Blackout
Battlefield
A statistical archive of rivalries, dynasties, cursed lineups, and commissioner-approved historical revisionism.
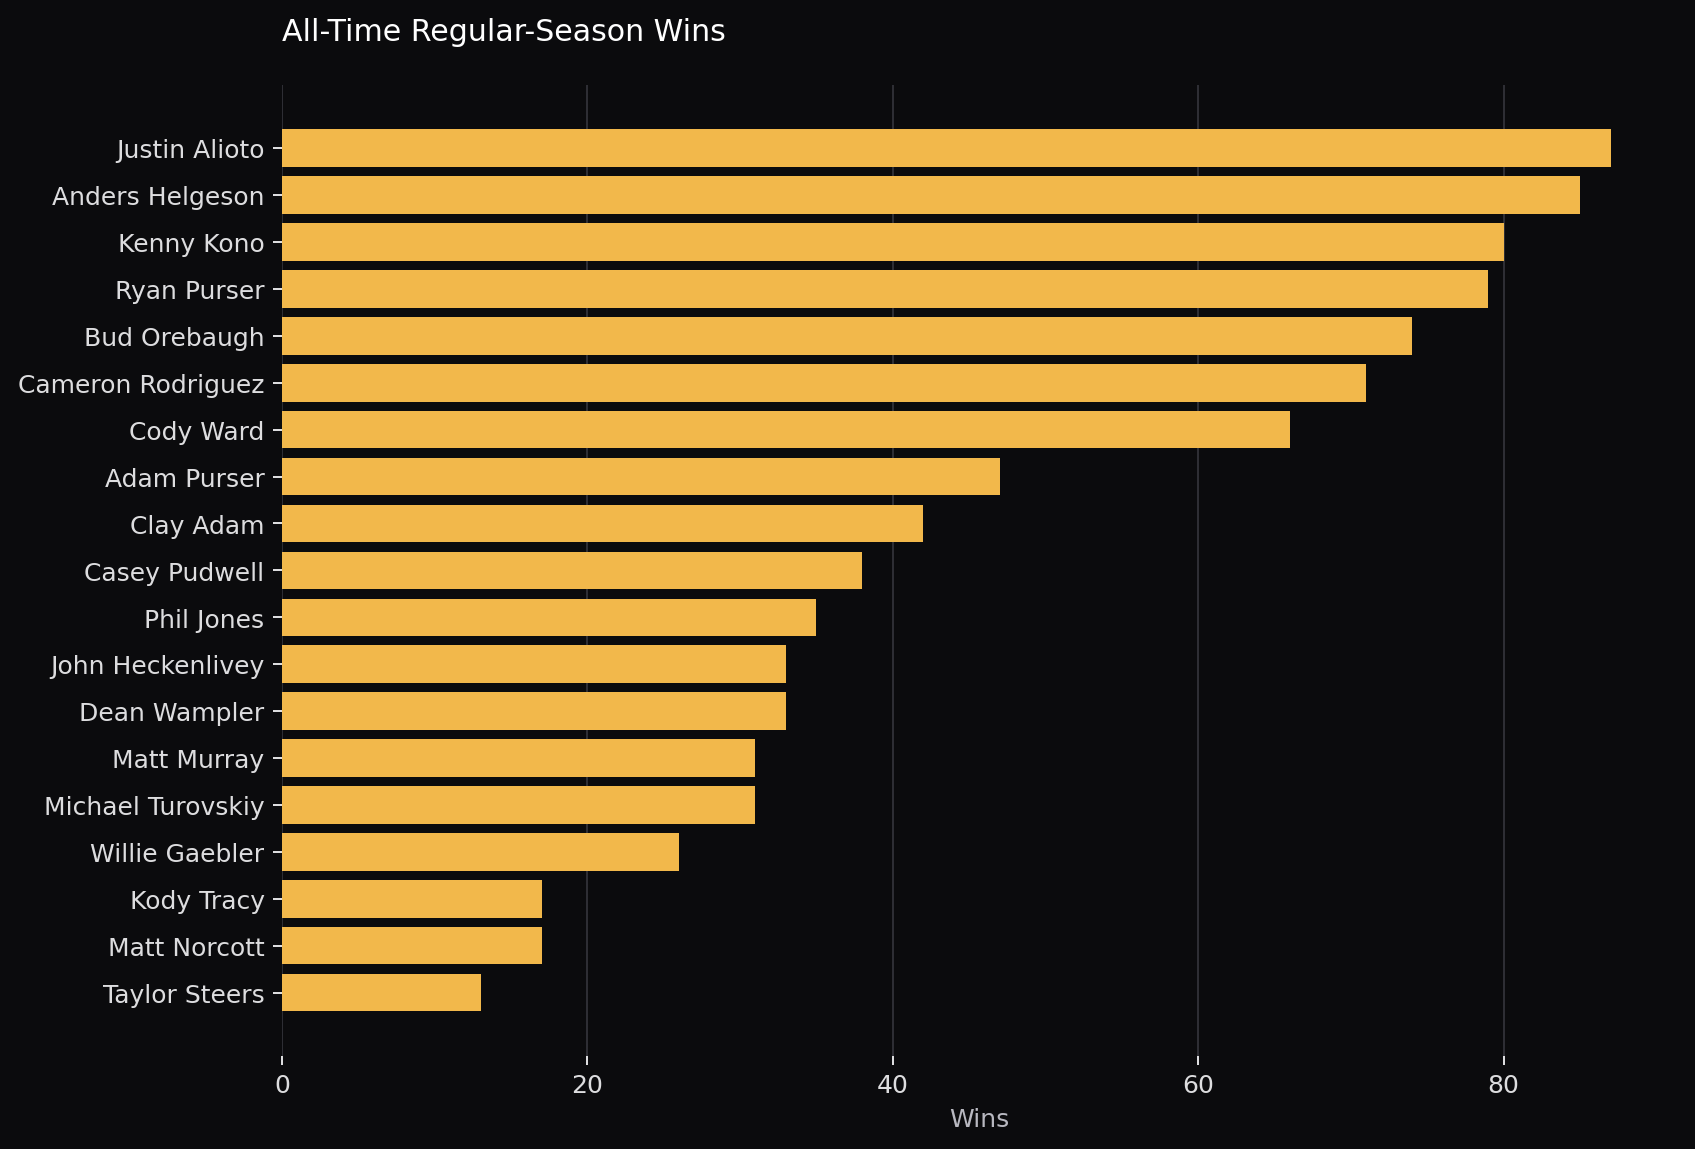
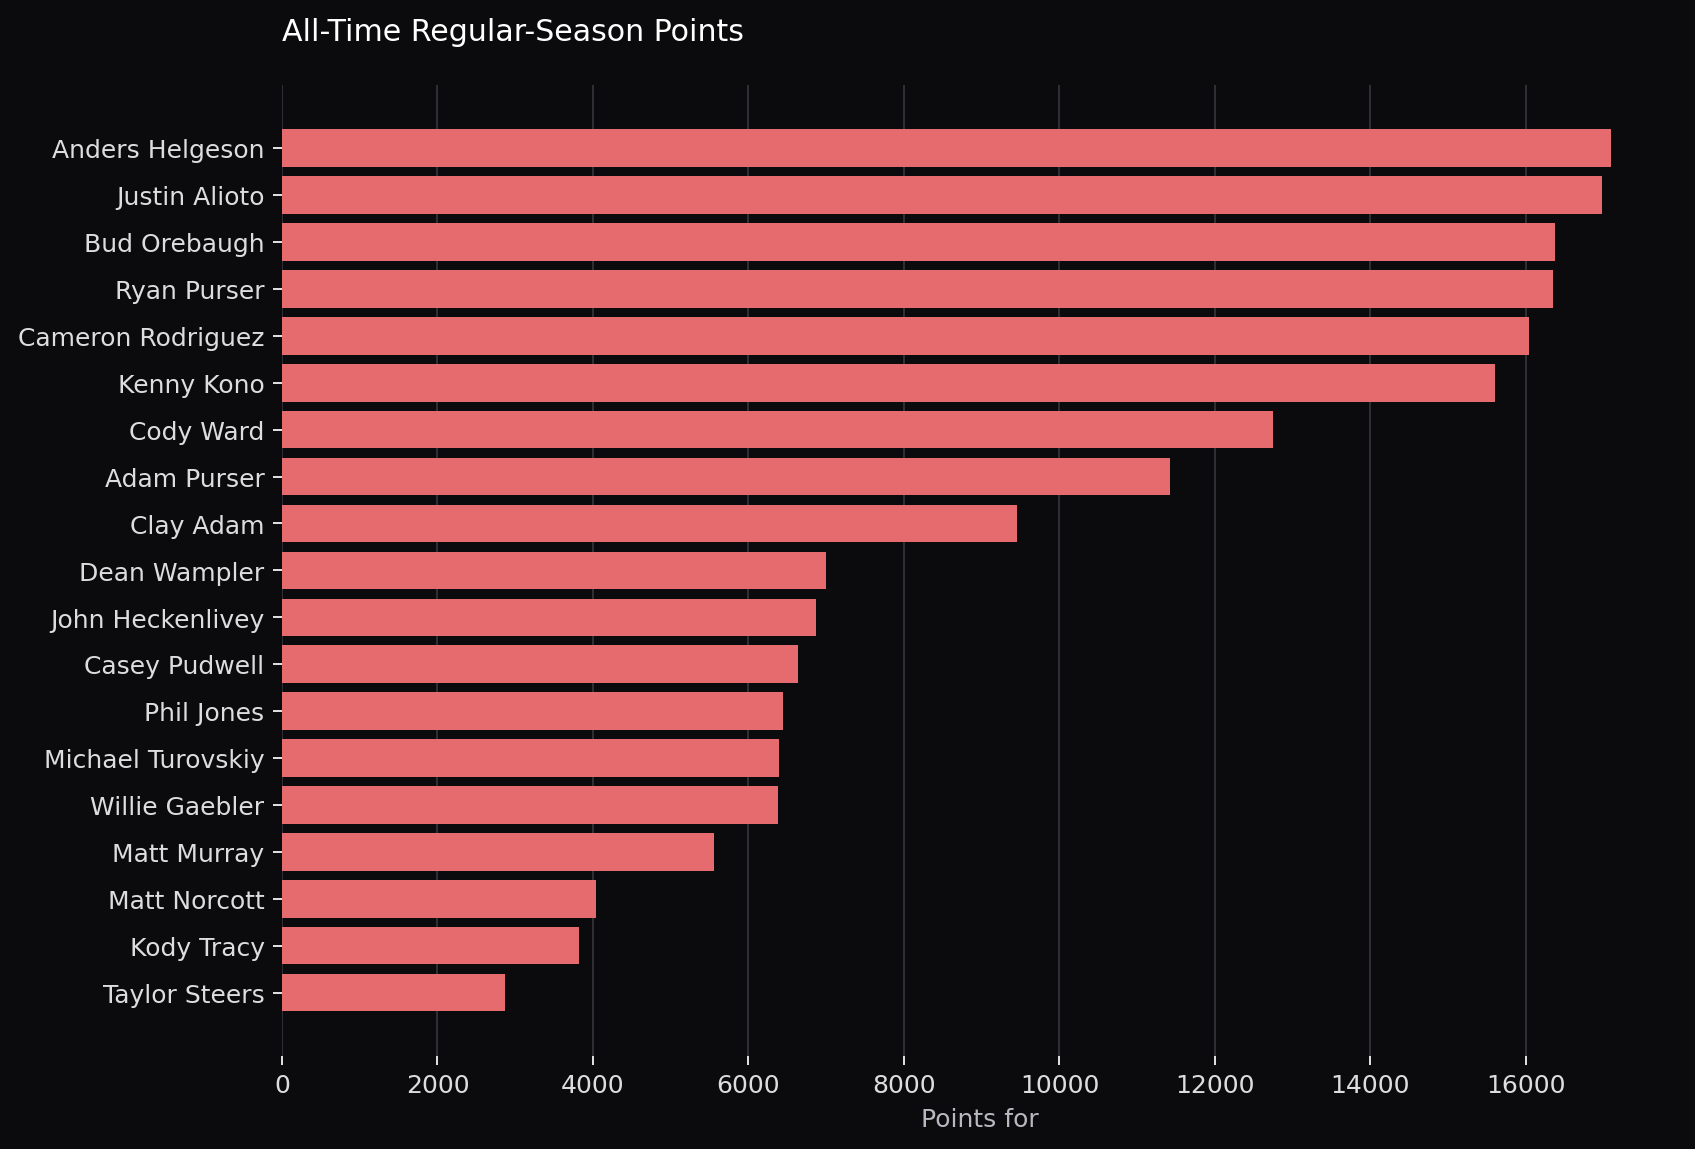
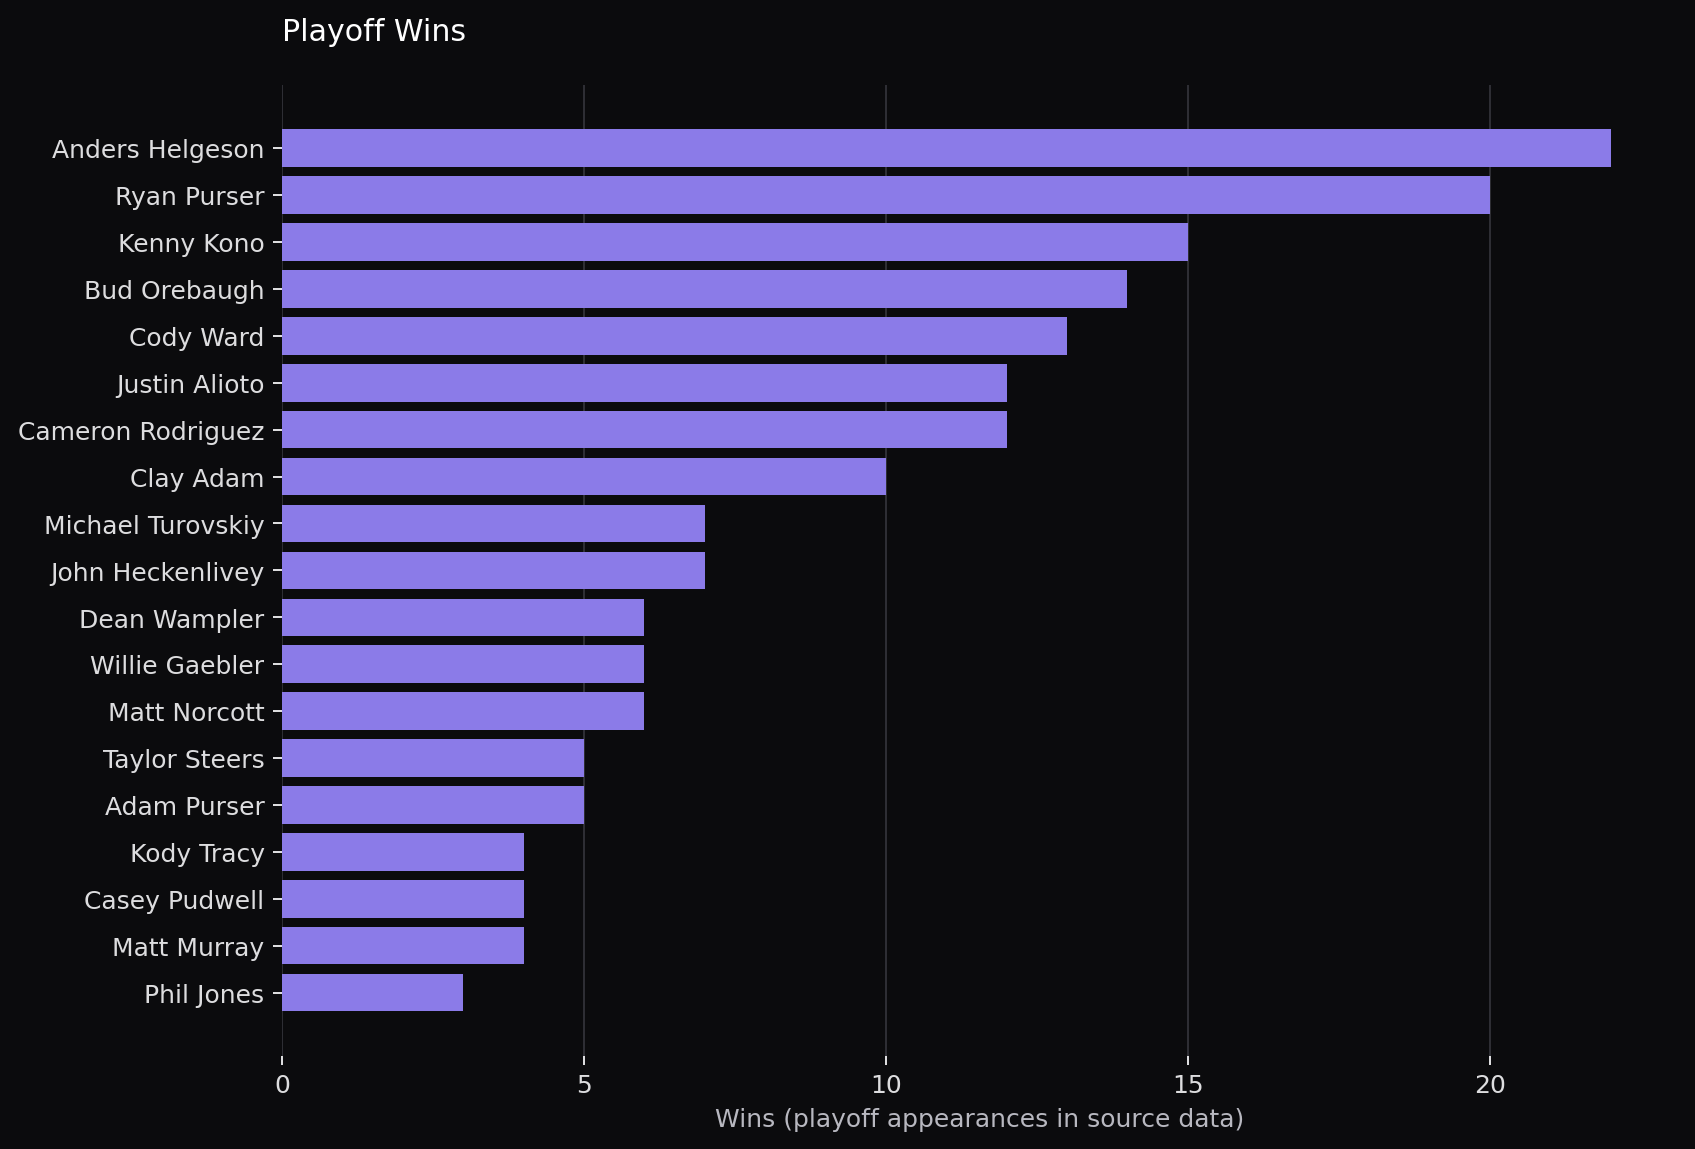
Manager history charts include only managers with at least two seasons in the league; one-season managers remain in the underlying archive.
11 complete · 2026 active
Scoring rates
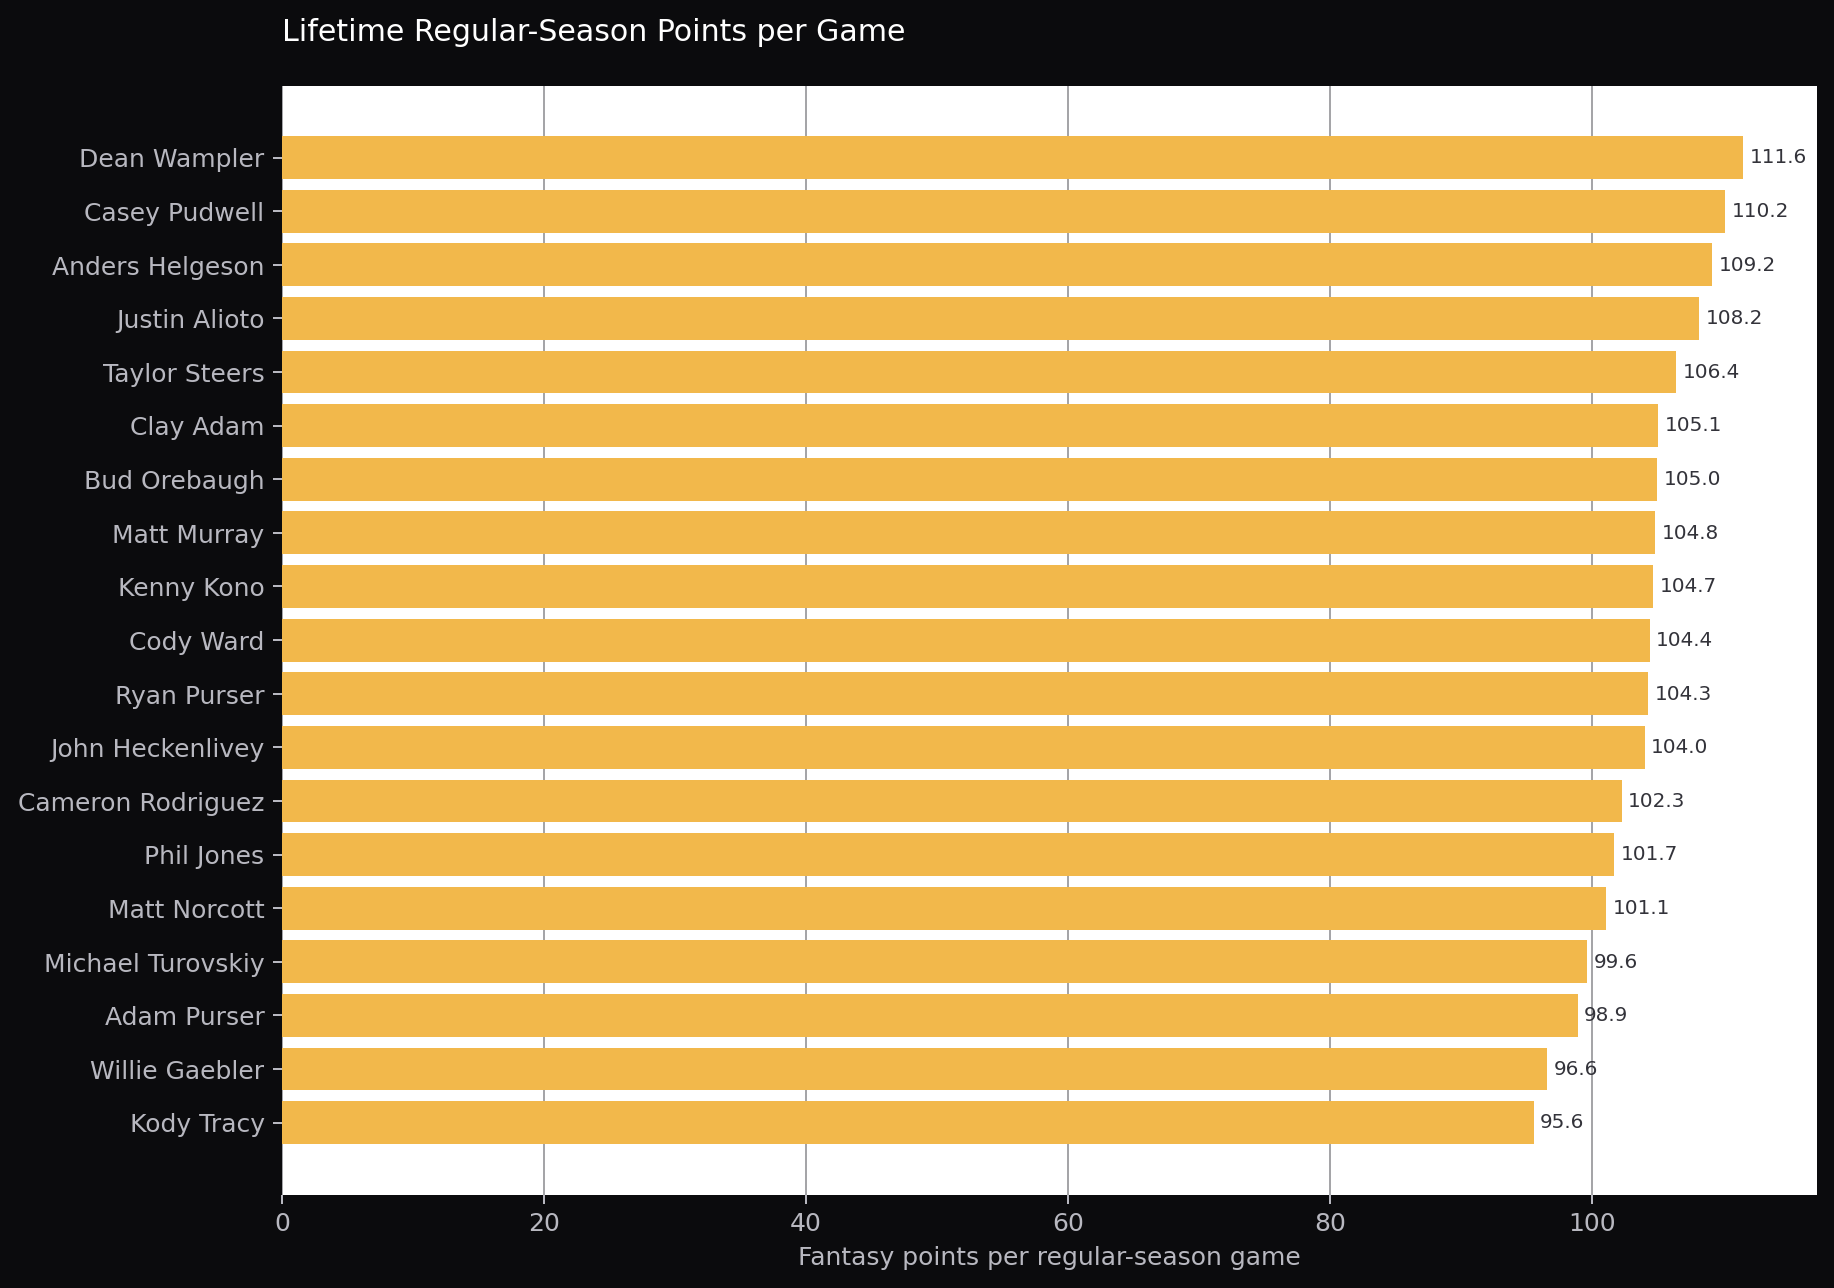
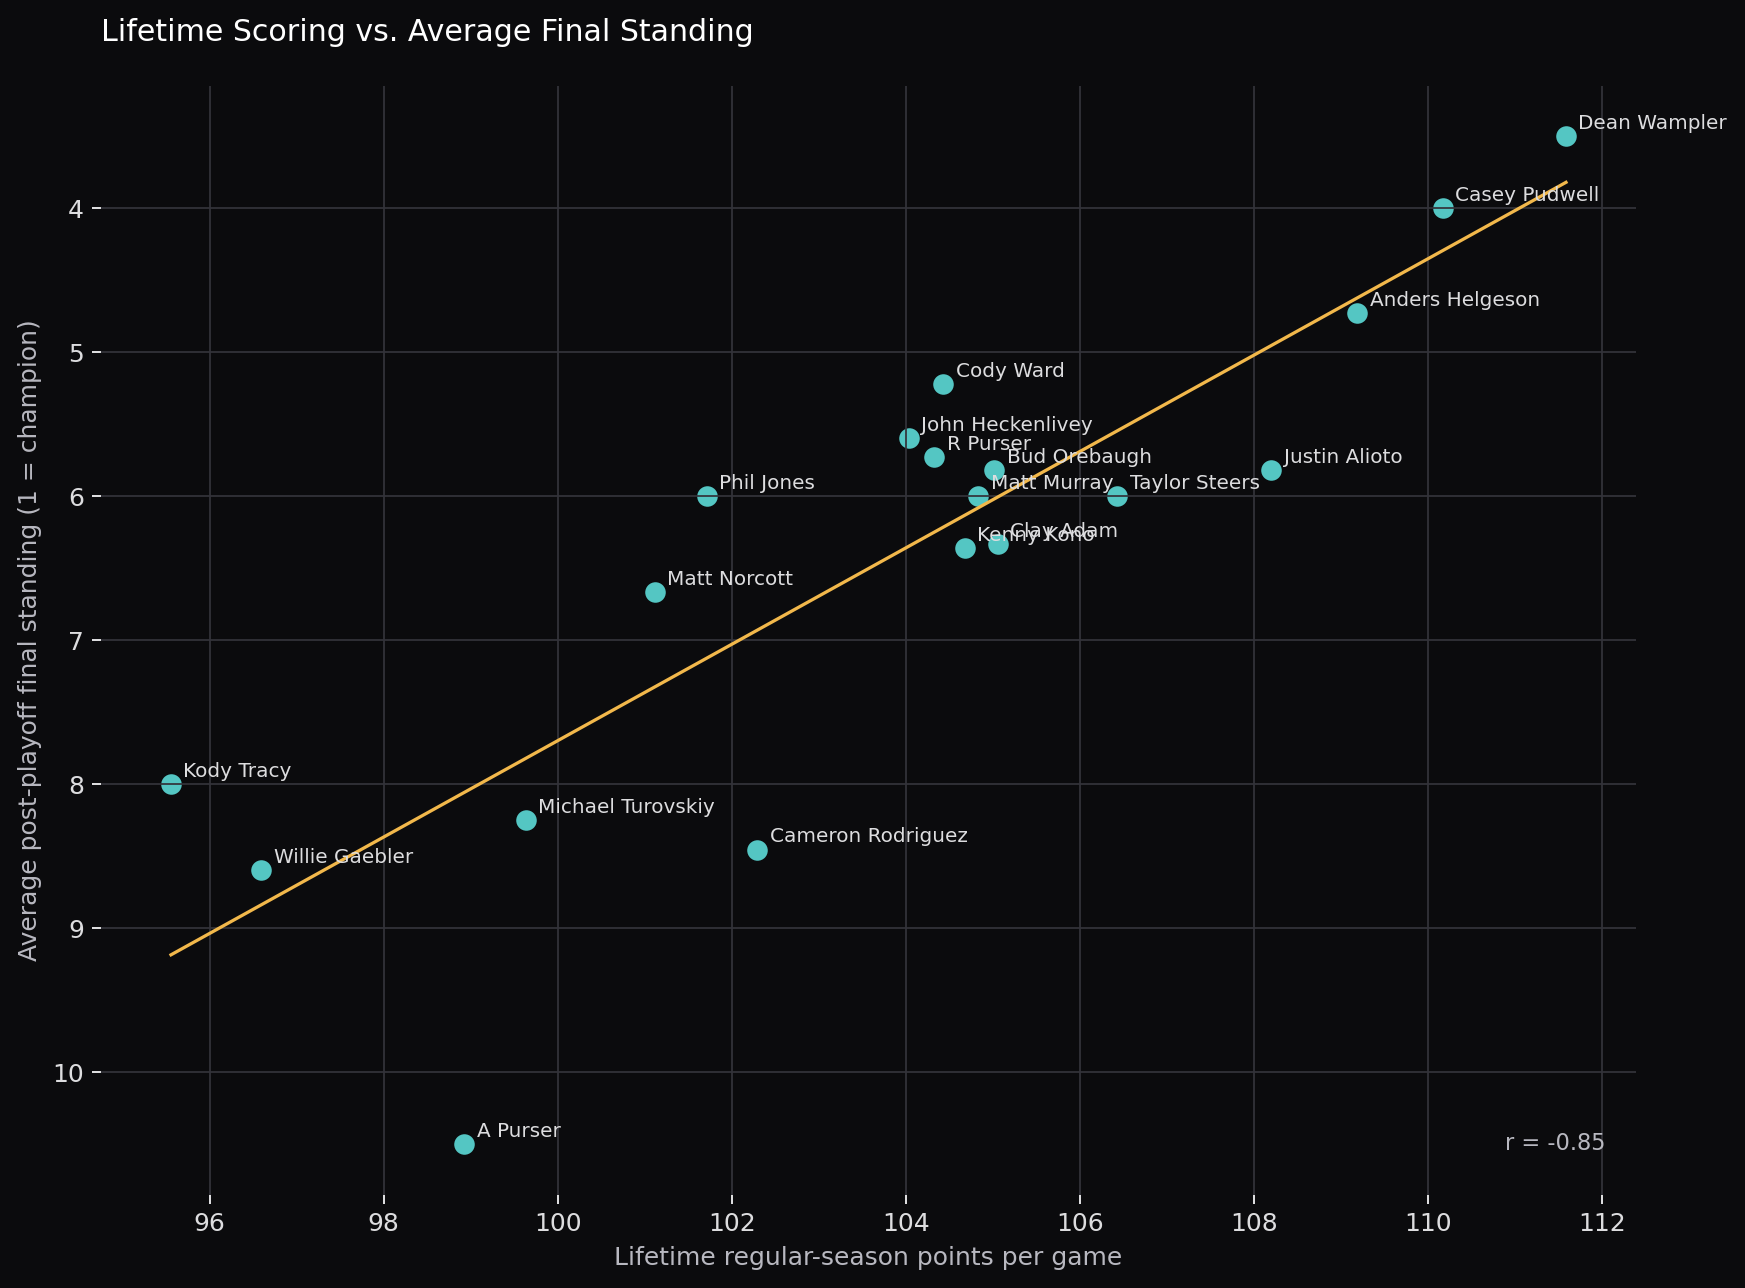
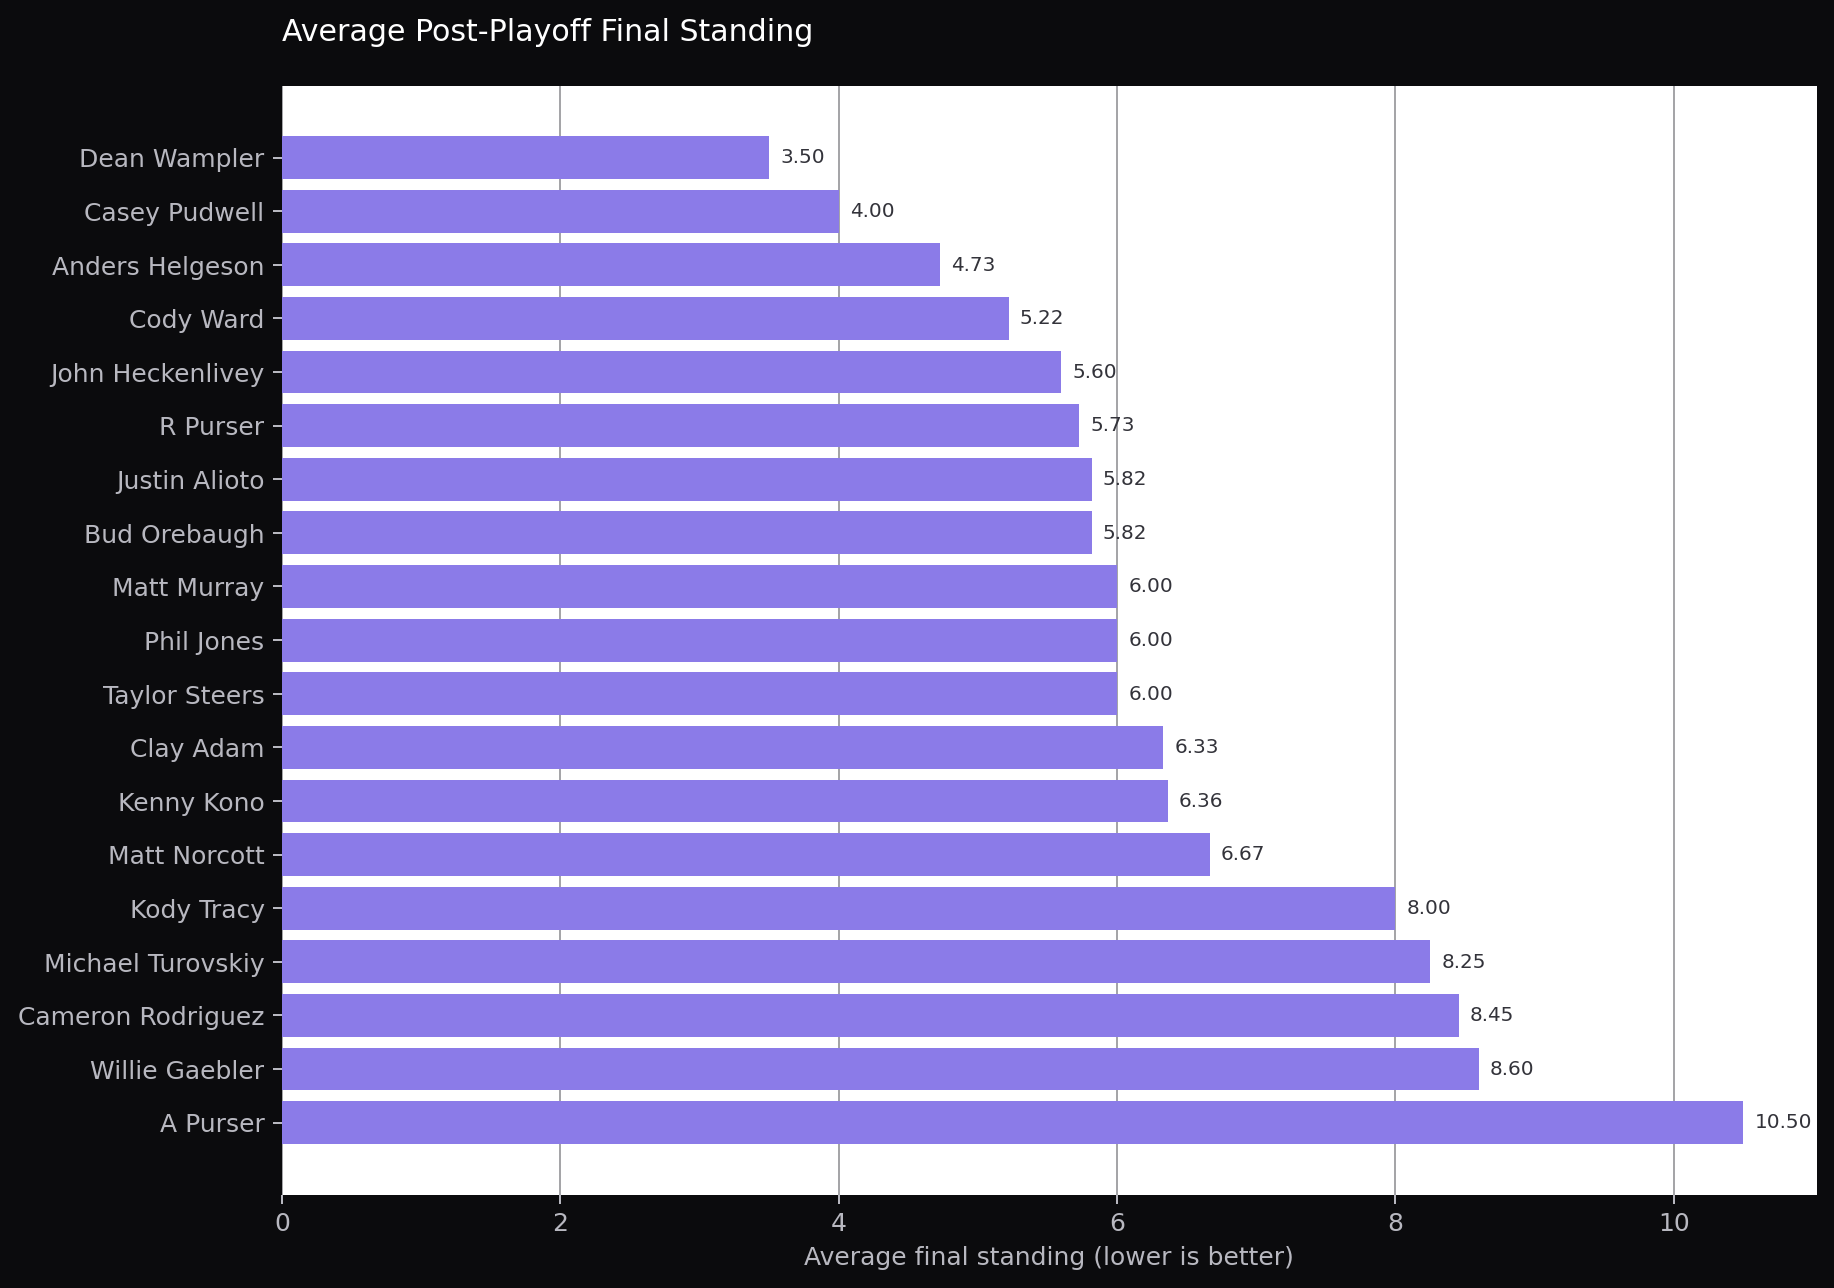
Lifetime scoring rates are compared with average post-playoff finish to show how much sustained scoring translated into standings success—and how much may have been left to luck.
Draft value and tendencies
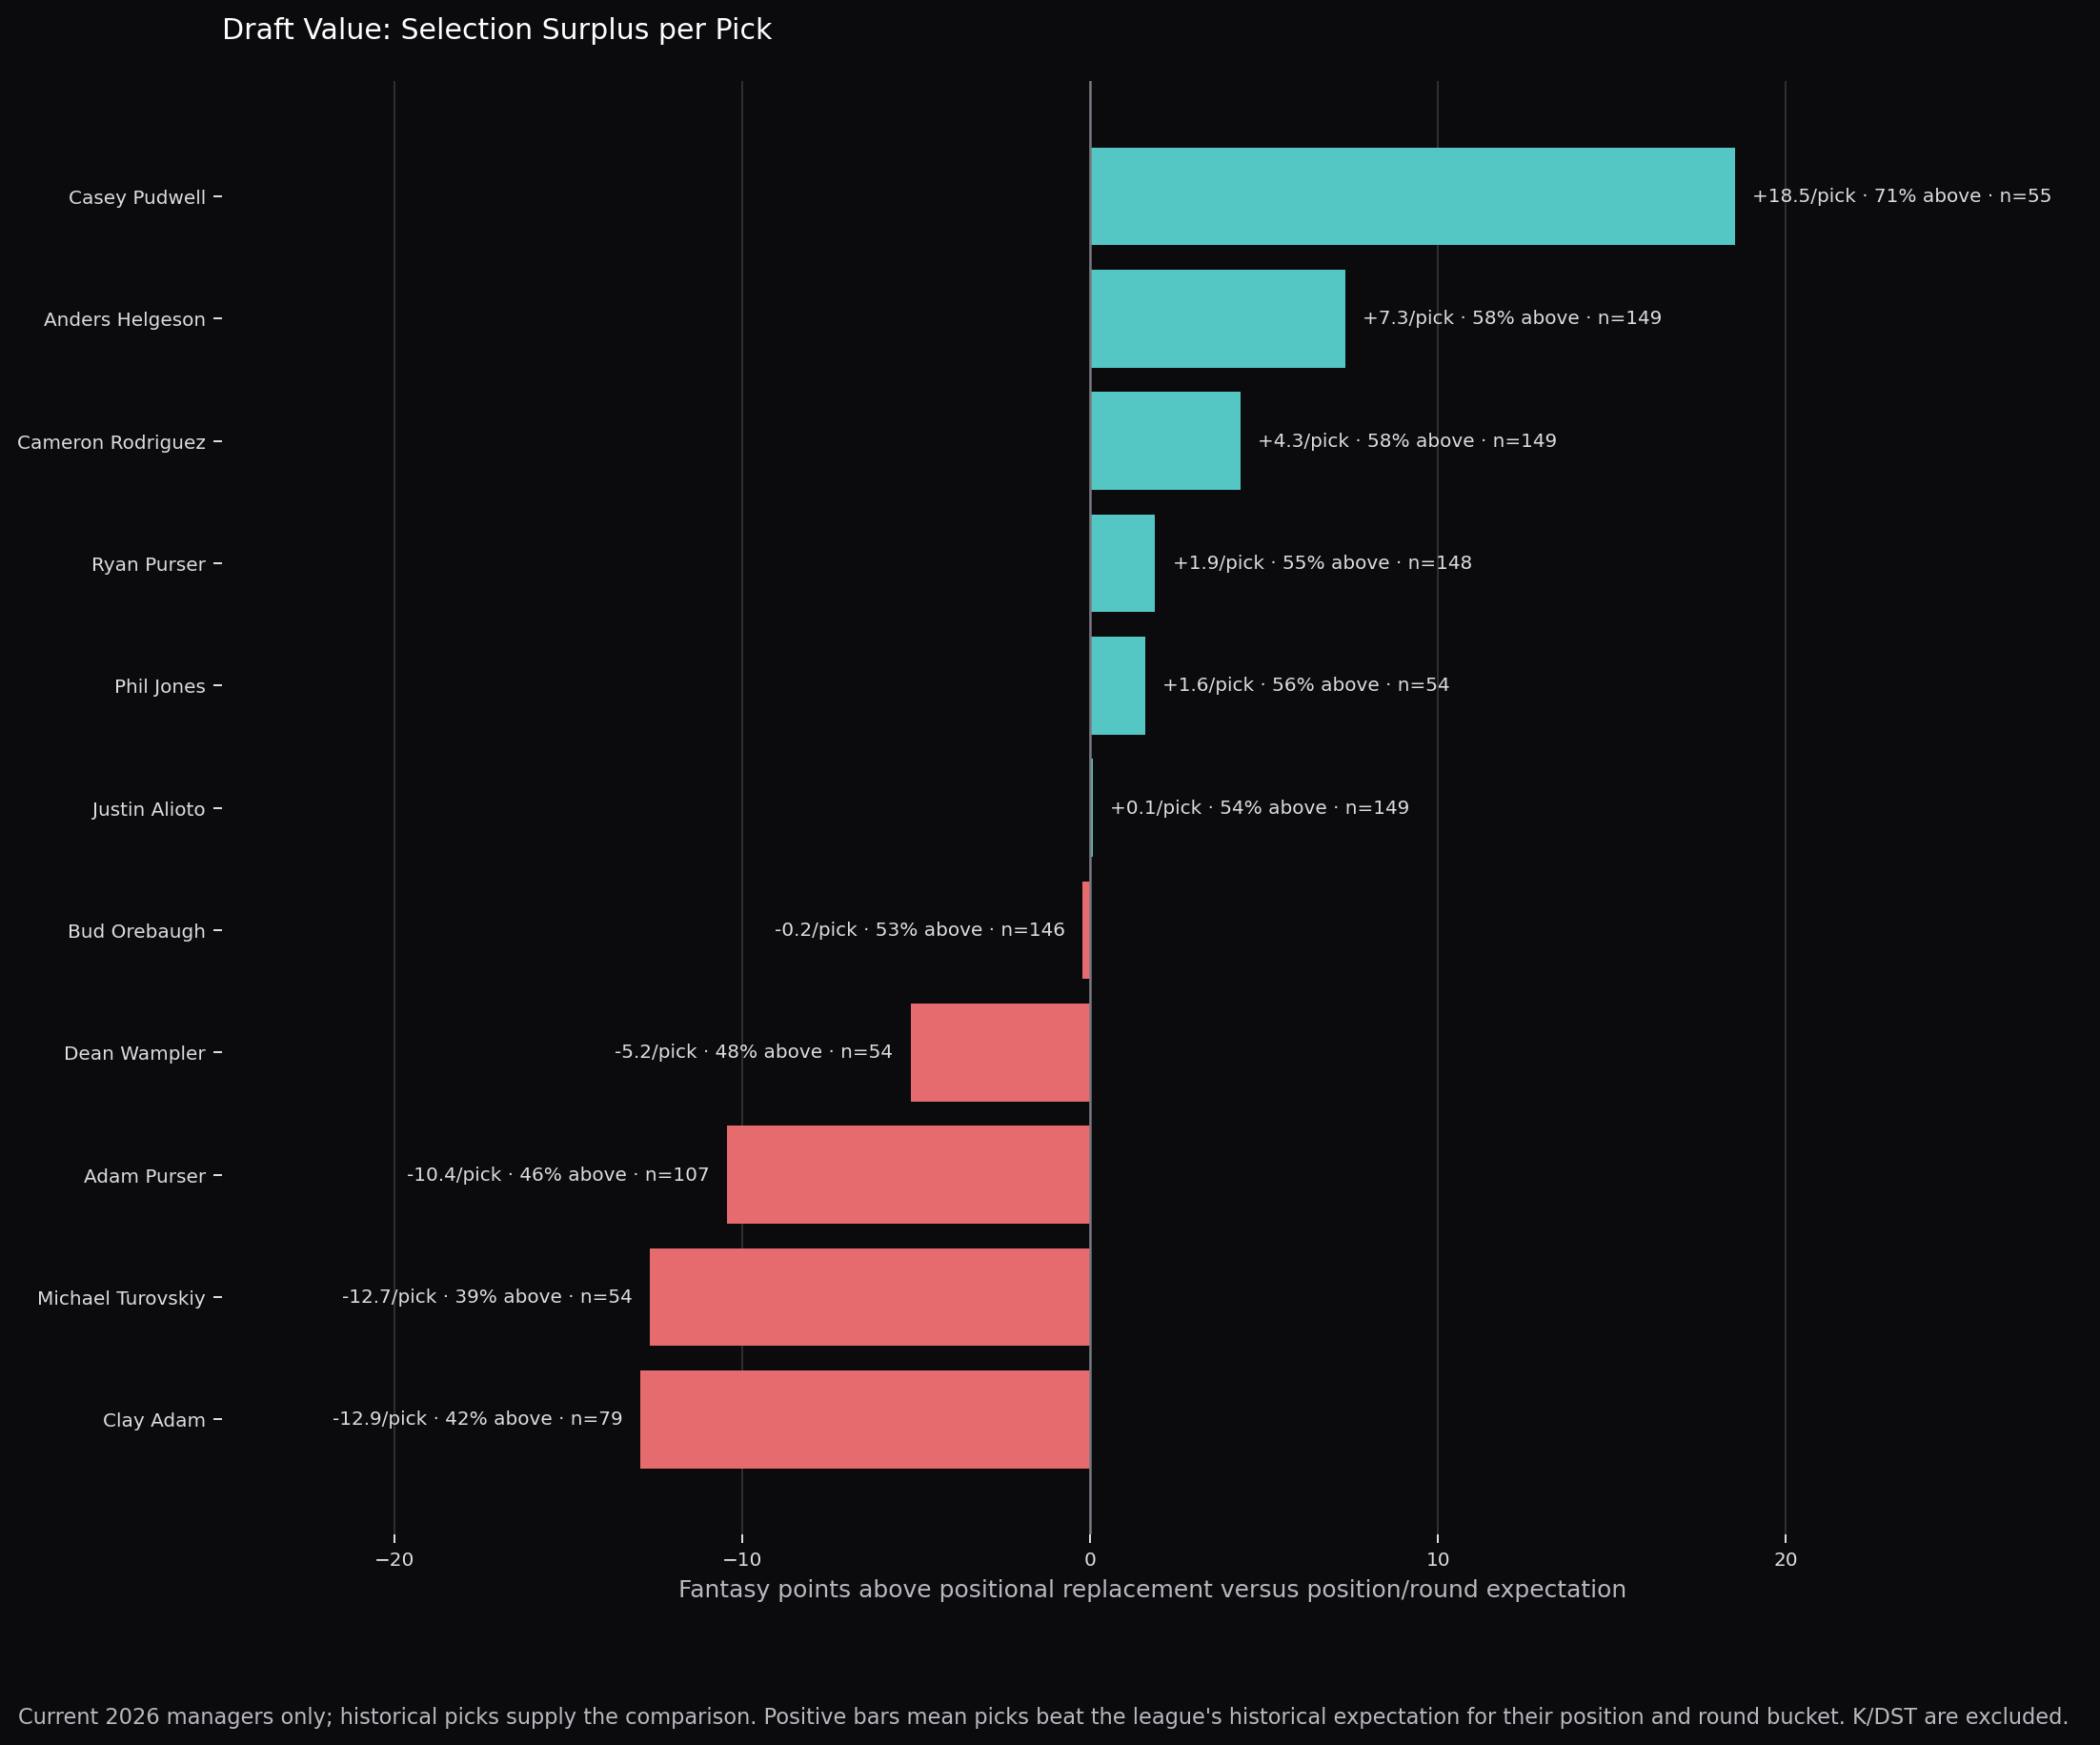
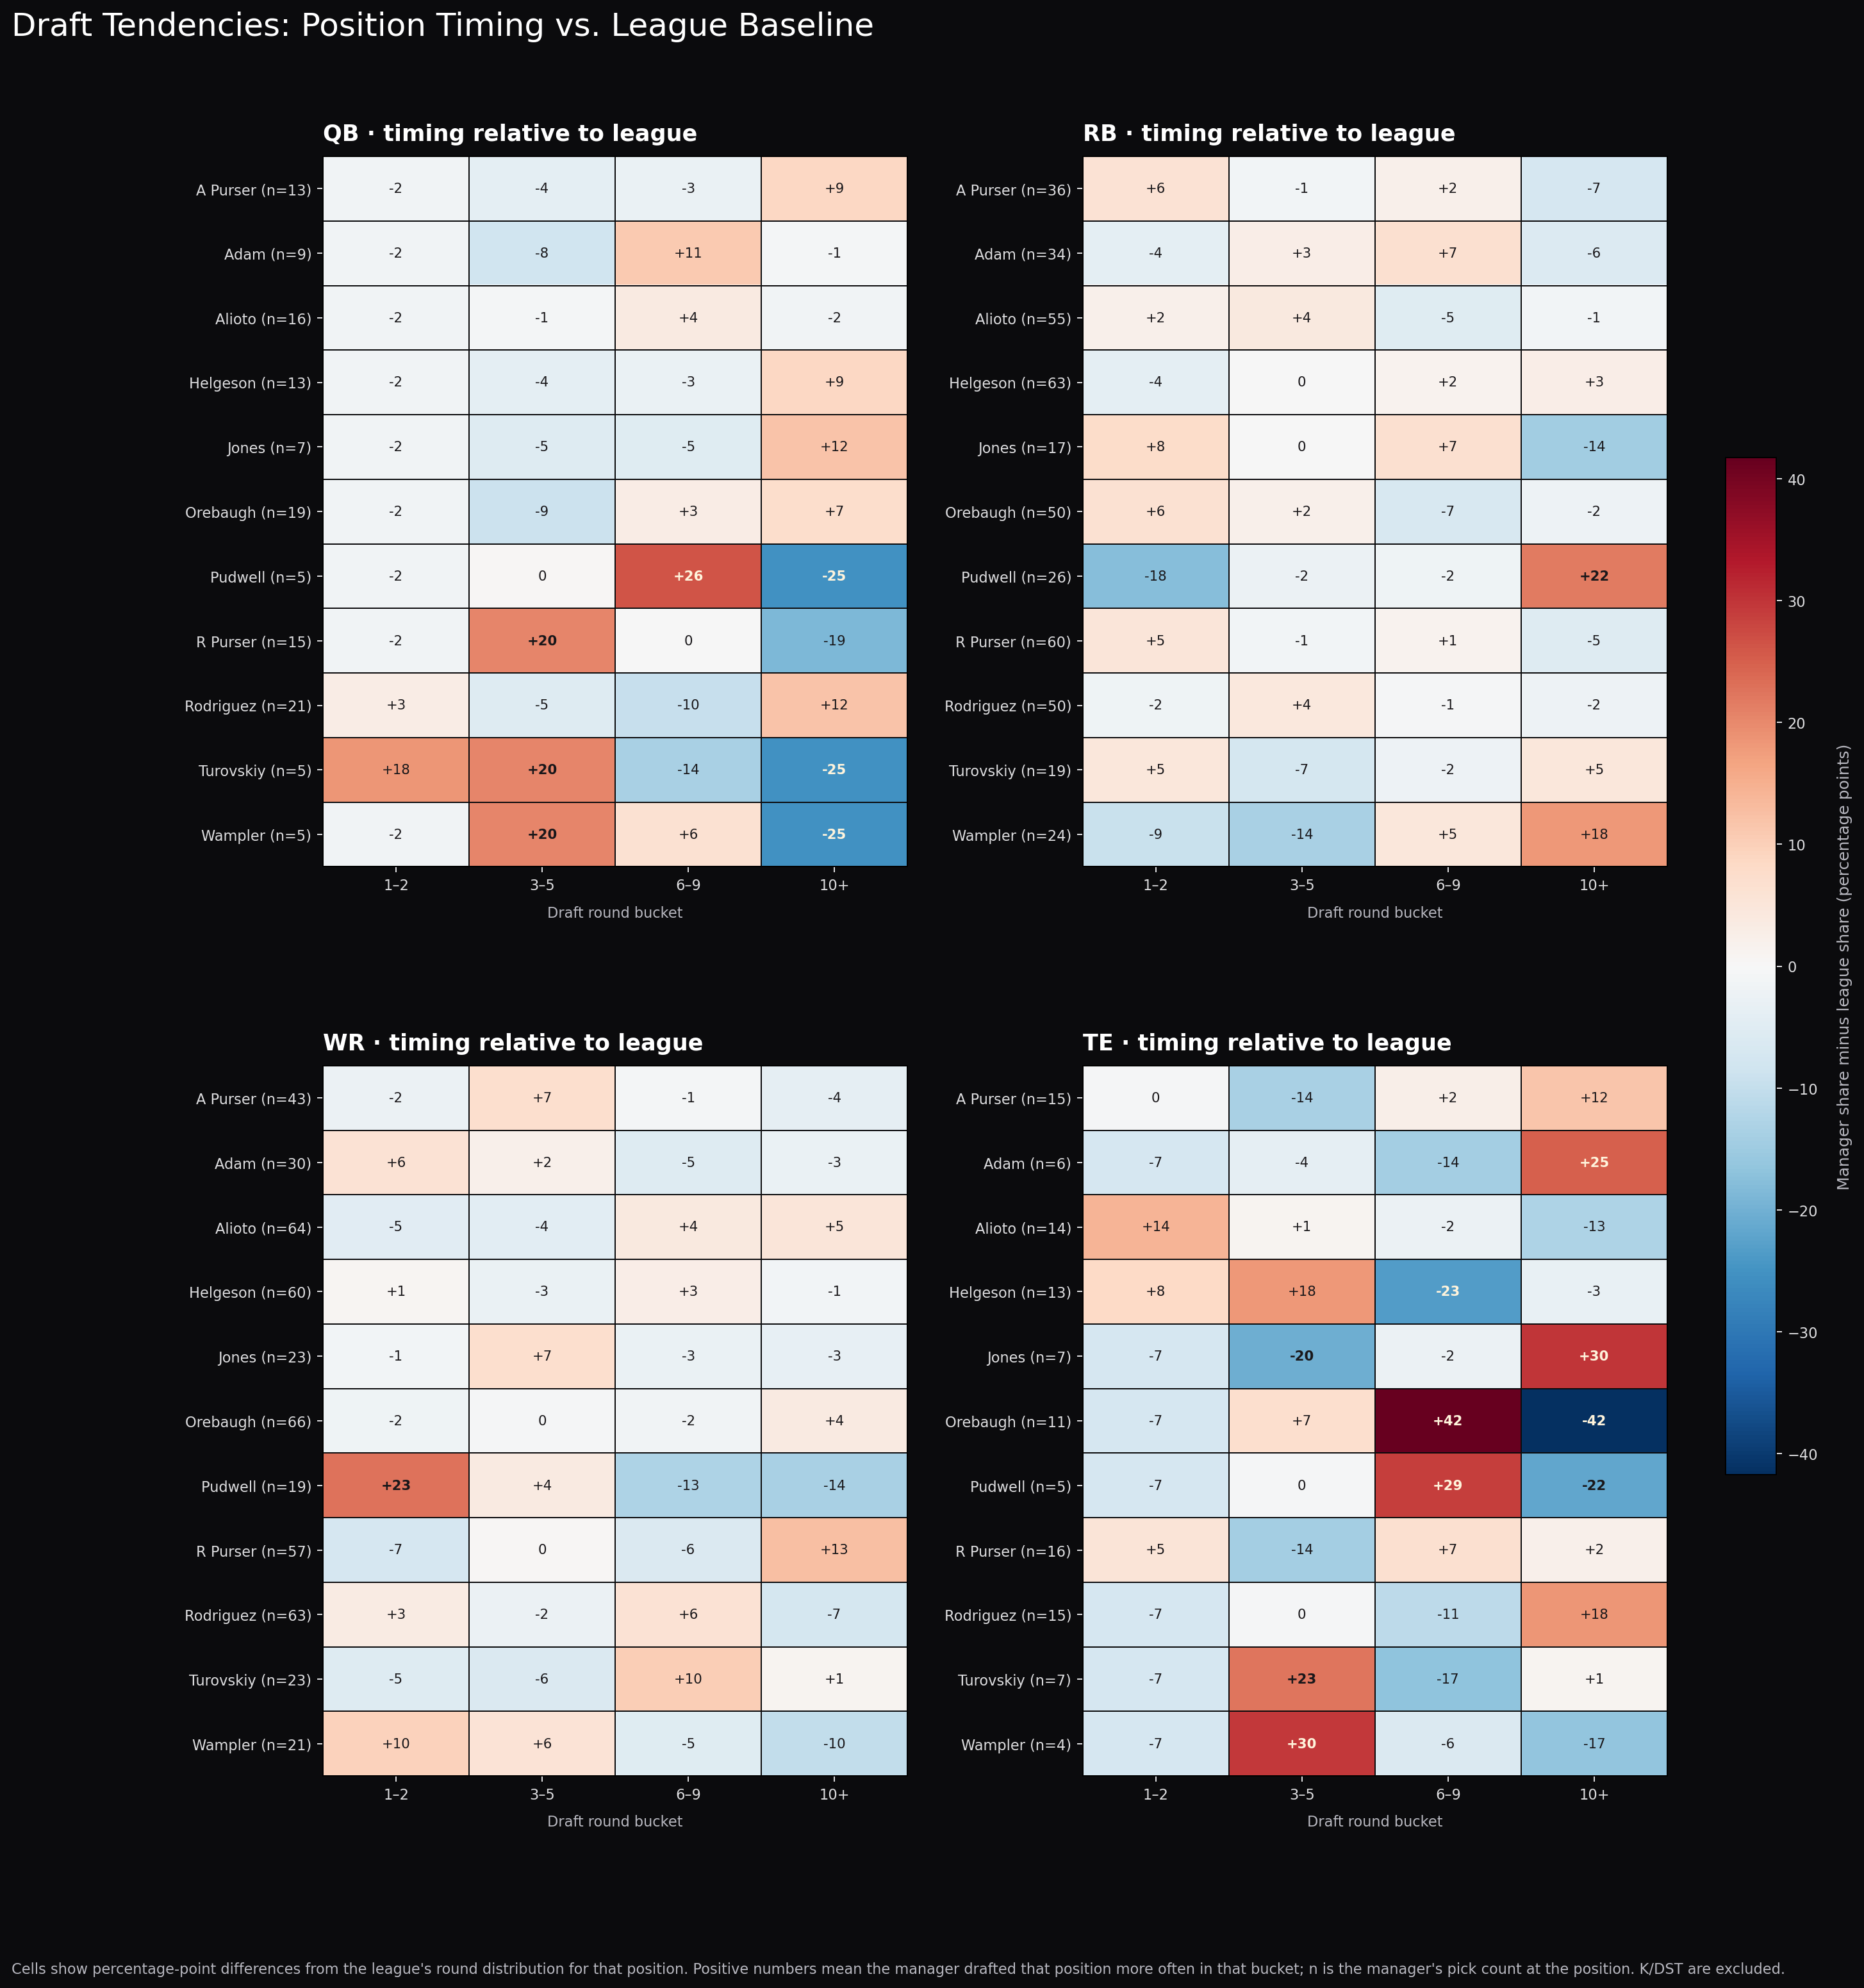
Draft Value measures core offensive selection surplus against the historical value of the same position and round bucket. These charts are limited to managers with a current 2026 team, while their historical picks supply the comparison. The tendency view compares each manager’s position timing with the league-wide pattern and shows the pick count behind each comparison. K/DST are reserved for a later position-specific baseline.
How to read Draft Value
For every drafted QB, RB, WR, and TE in a completed season, we calculate how many fantasy points the player scored above the replacement level for that position. We then compare that result with the historical average for players drafted at the same position and in the same round bucket: rounds 1–2, 3–5, 6–9, or 10+.
The bar shows the average surplus per pick across each current manager’s historical draft record. A positive number means the manager’s picks have produced more value than that position-and-round expectation; a negative number means they have produced less. The label includes the percentage of picks that beat expectation and n, the total number of picks in the sample.
This is a selection measure. Lineup choices, waiver additions, trades, schedule luck, and the decision to start or bench a player are outside the score. The historical baseline uses the full player pool, which gives the chart a common reference point across positions and draft eras.
Luck, volatility, and legacy
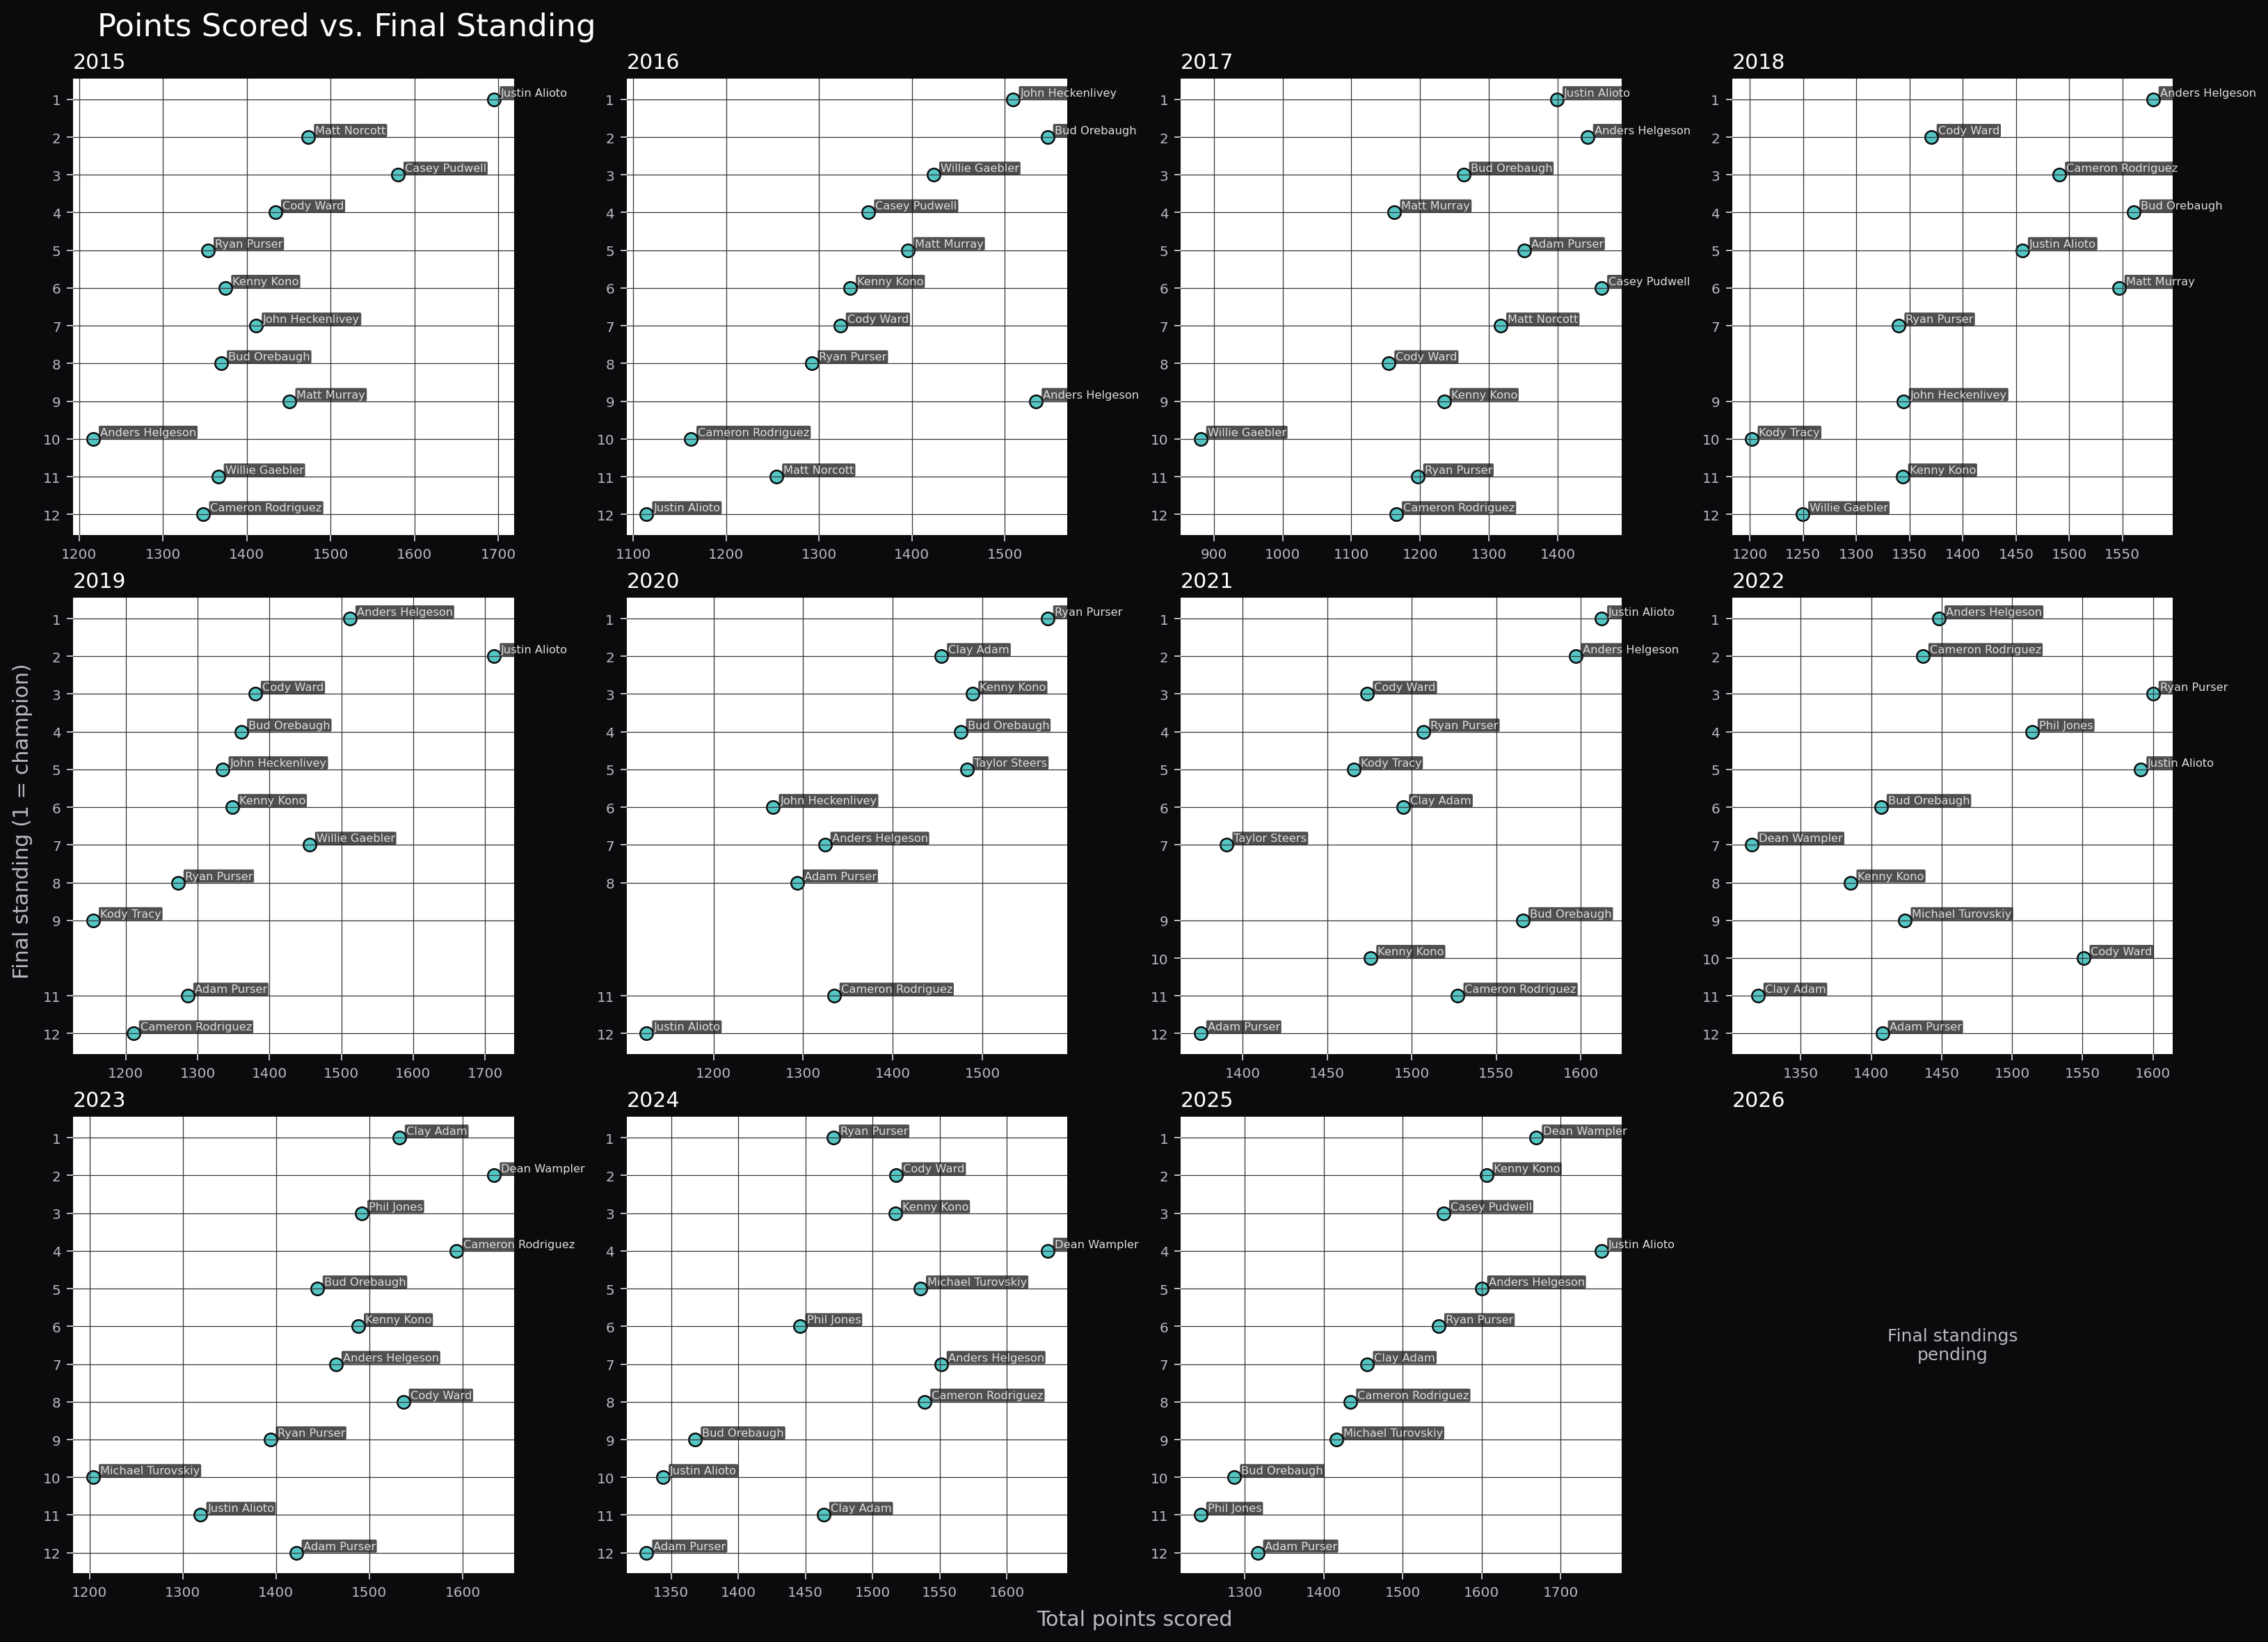
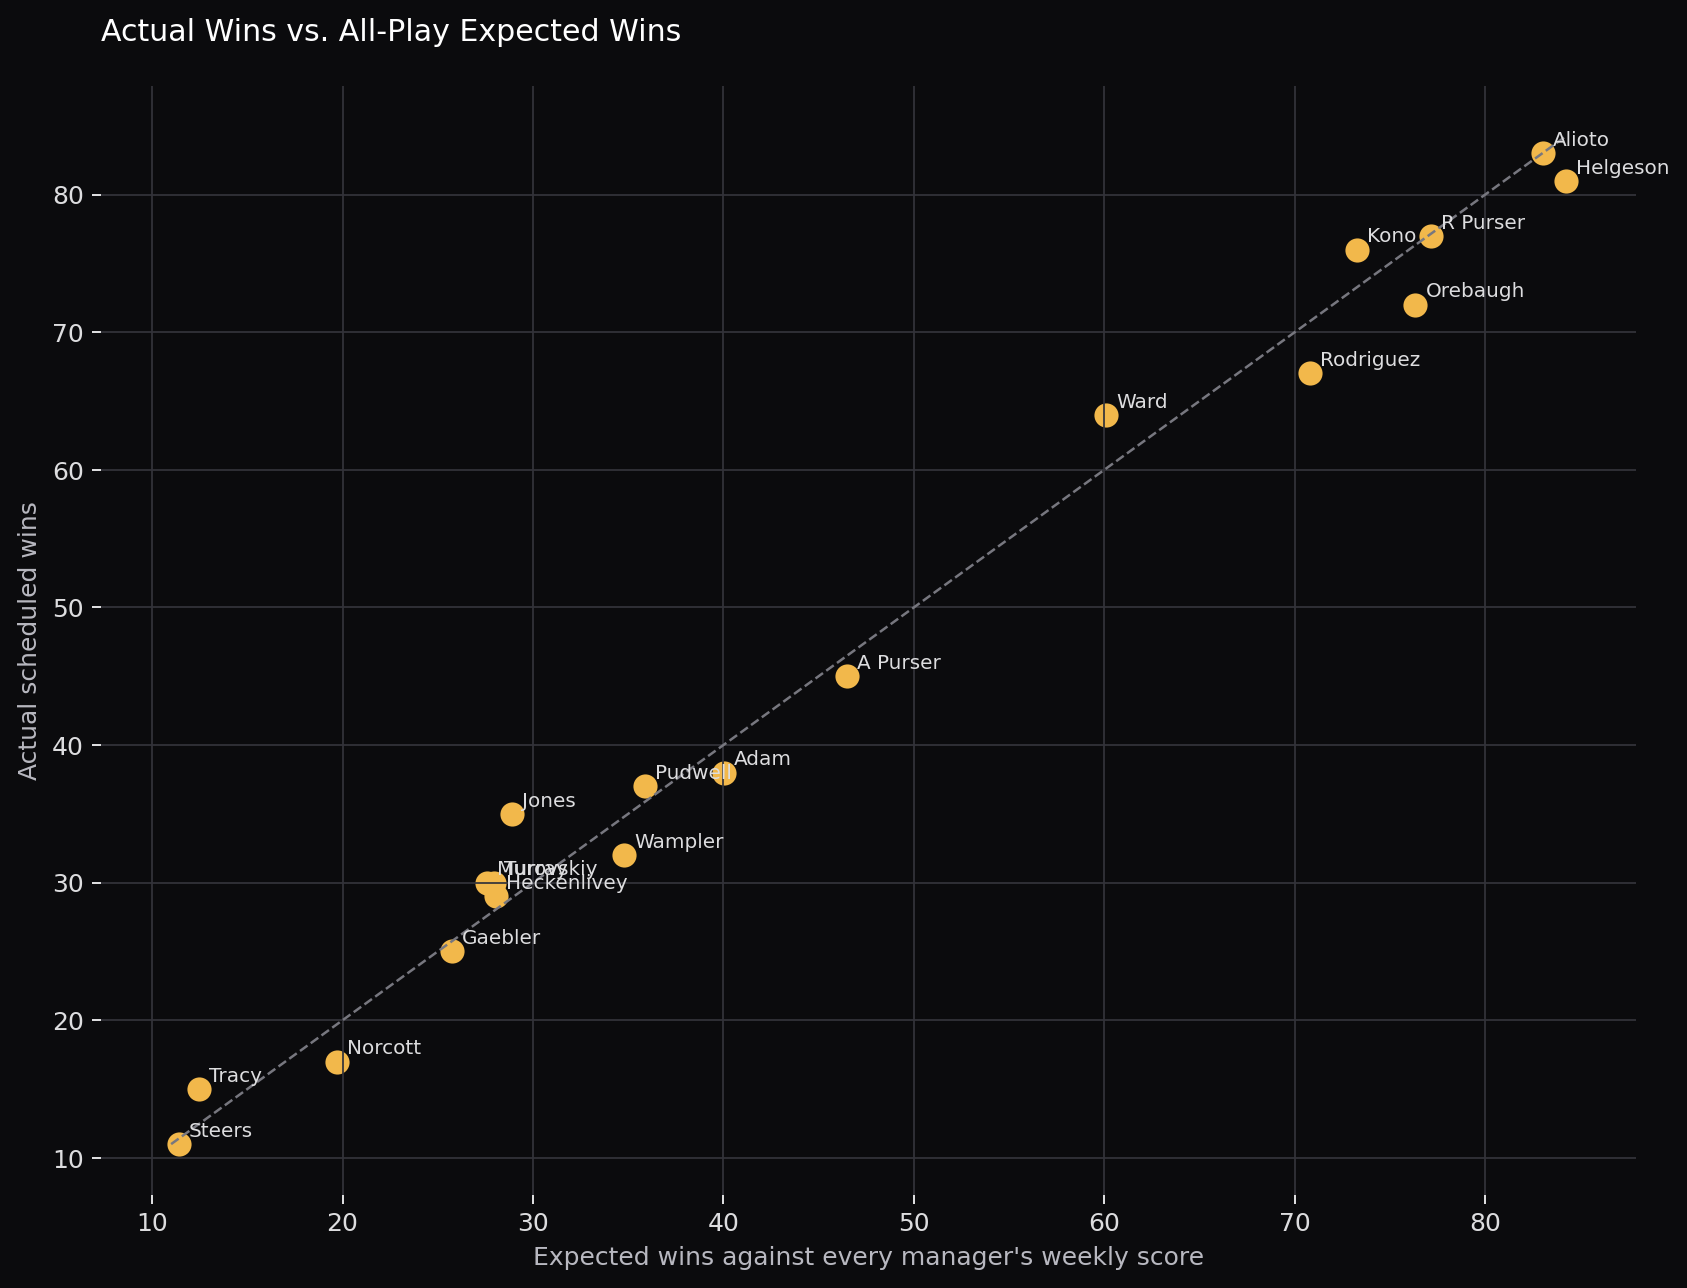
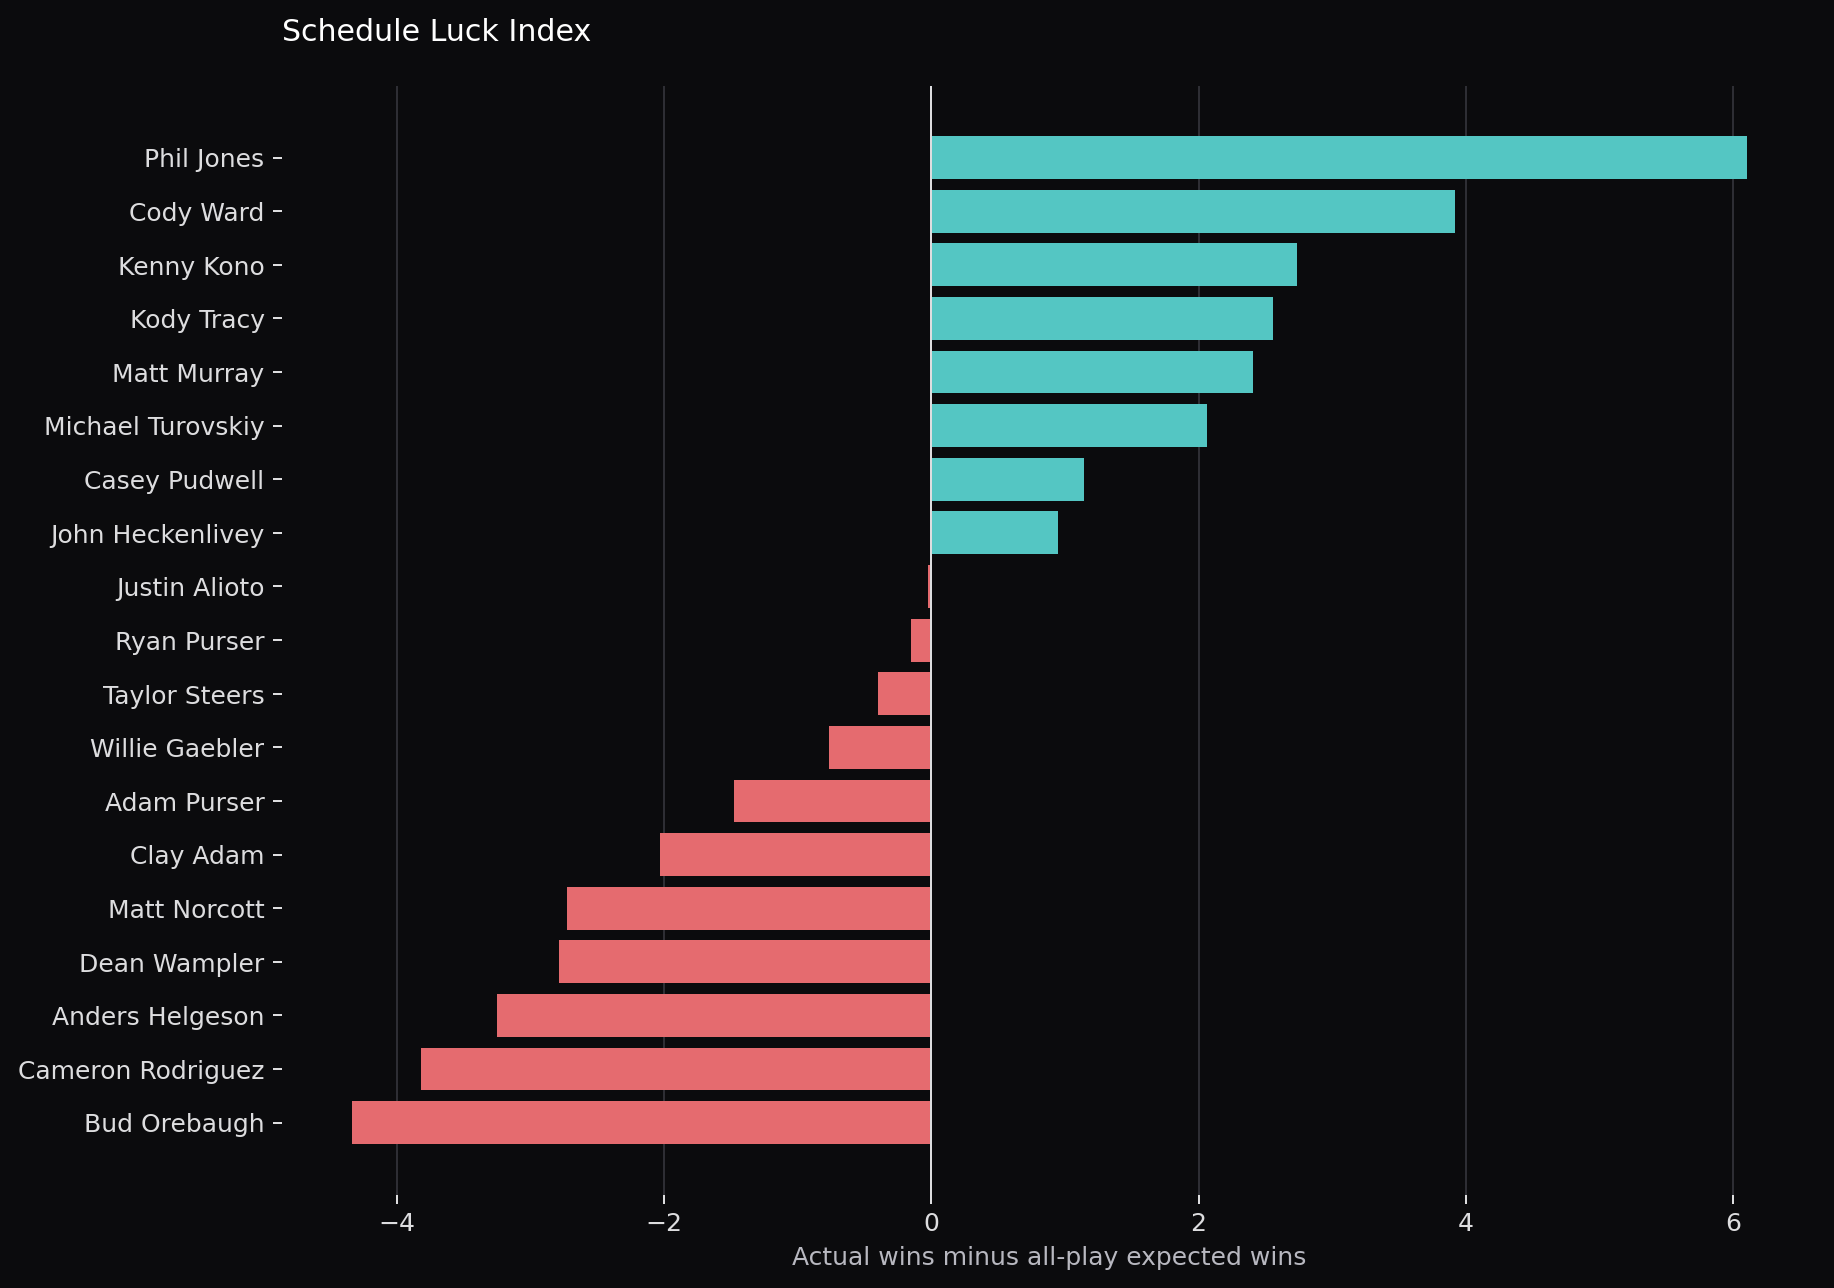
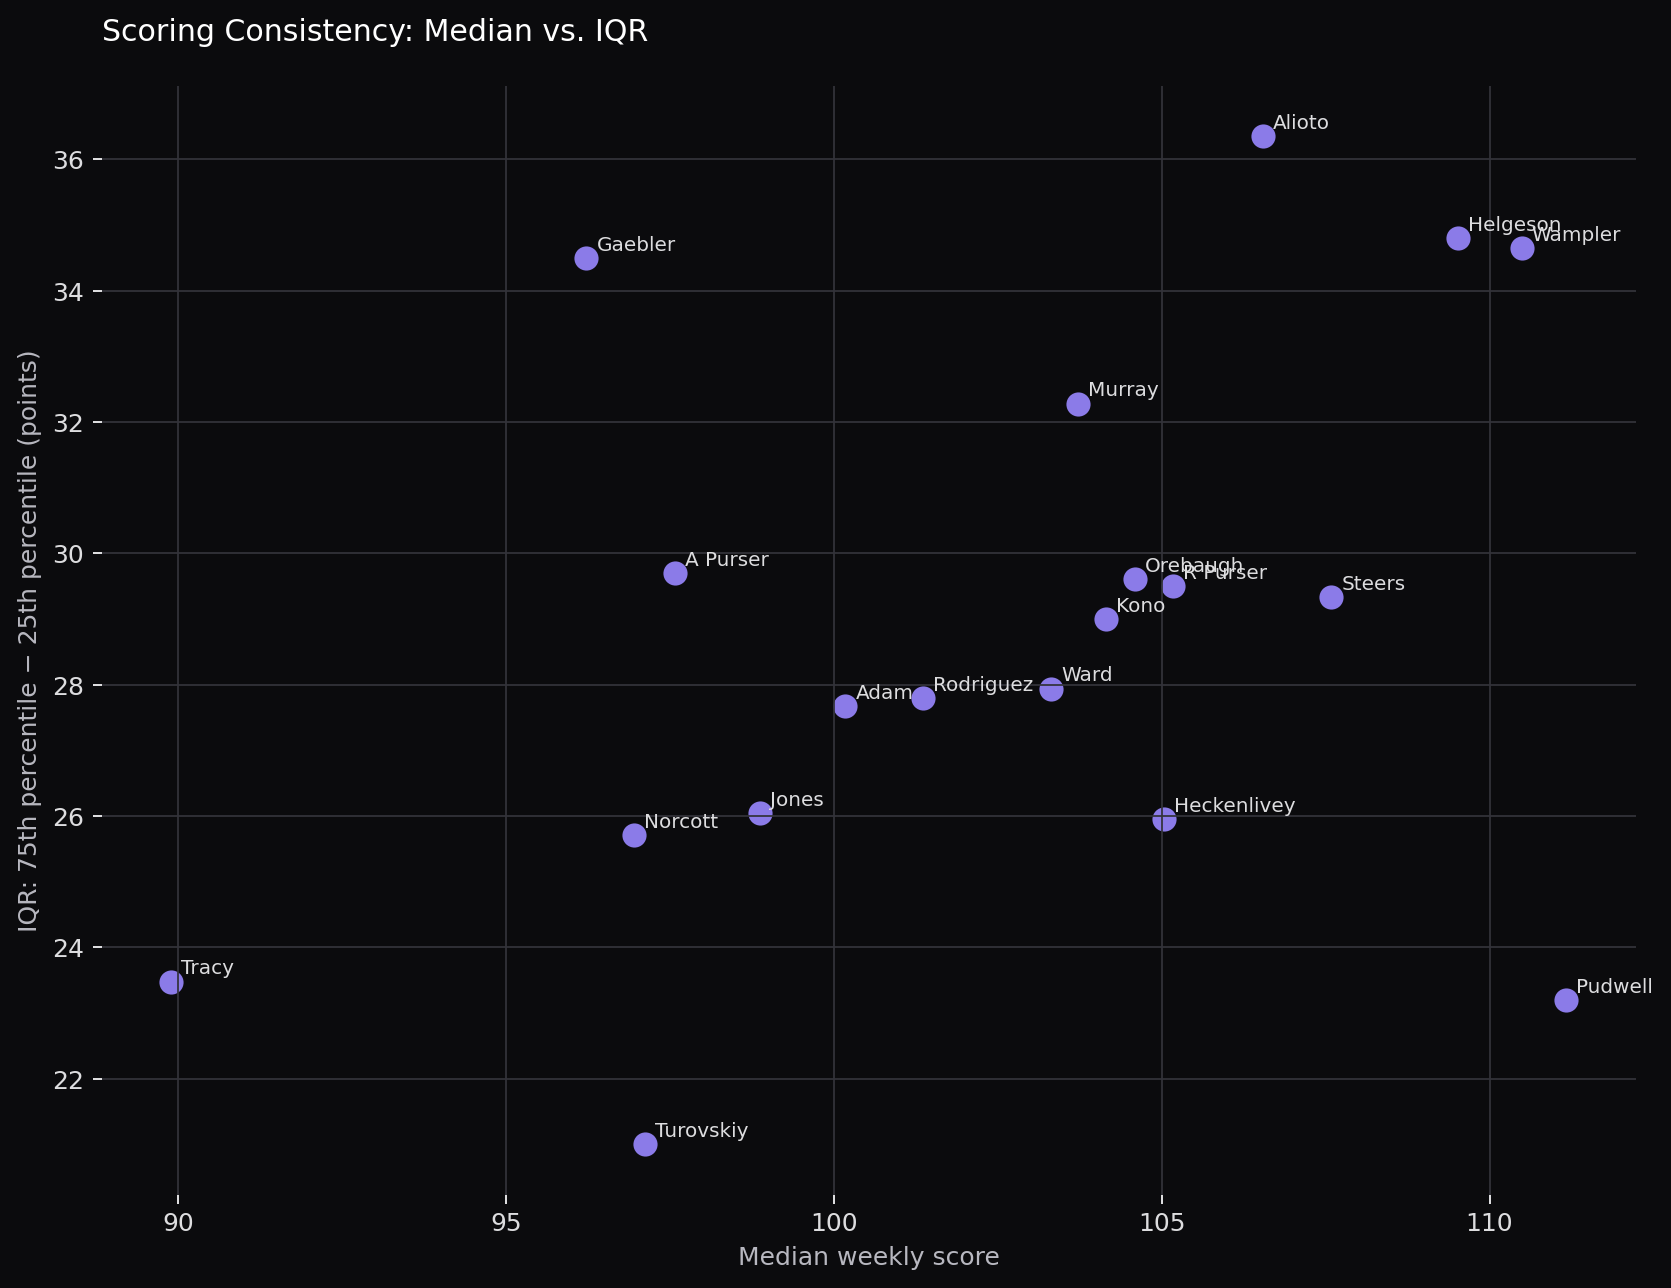
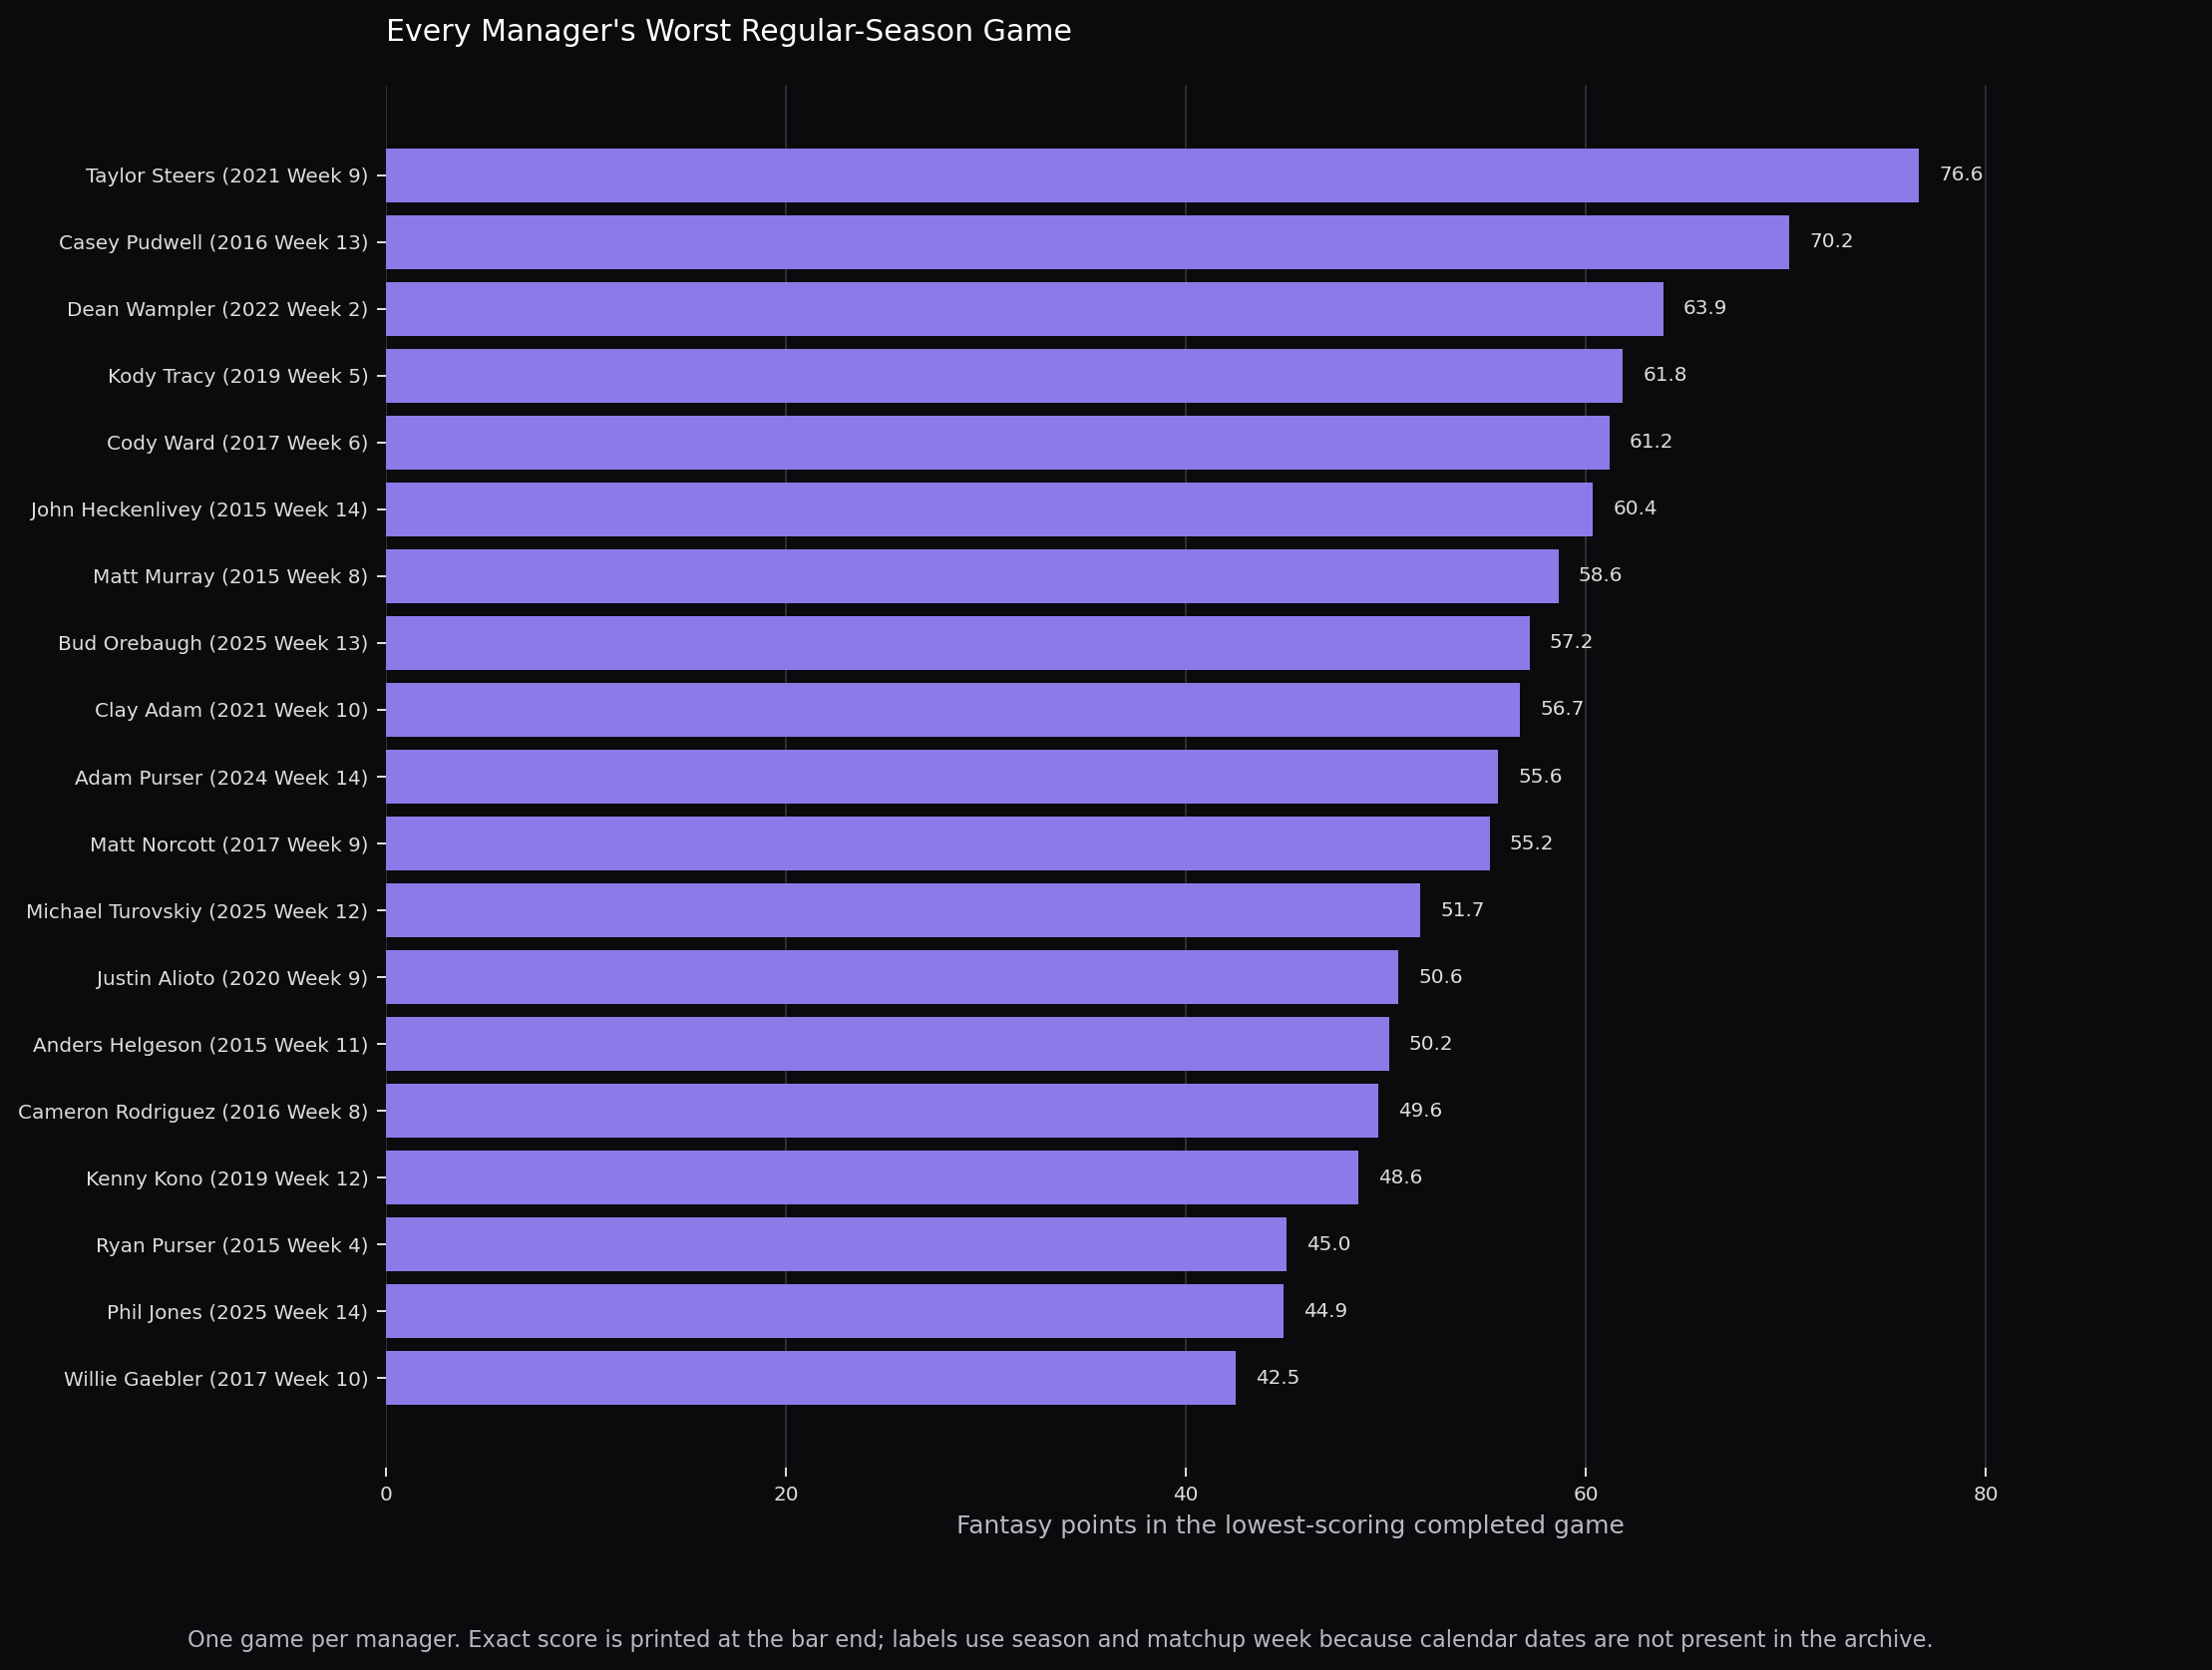
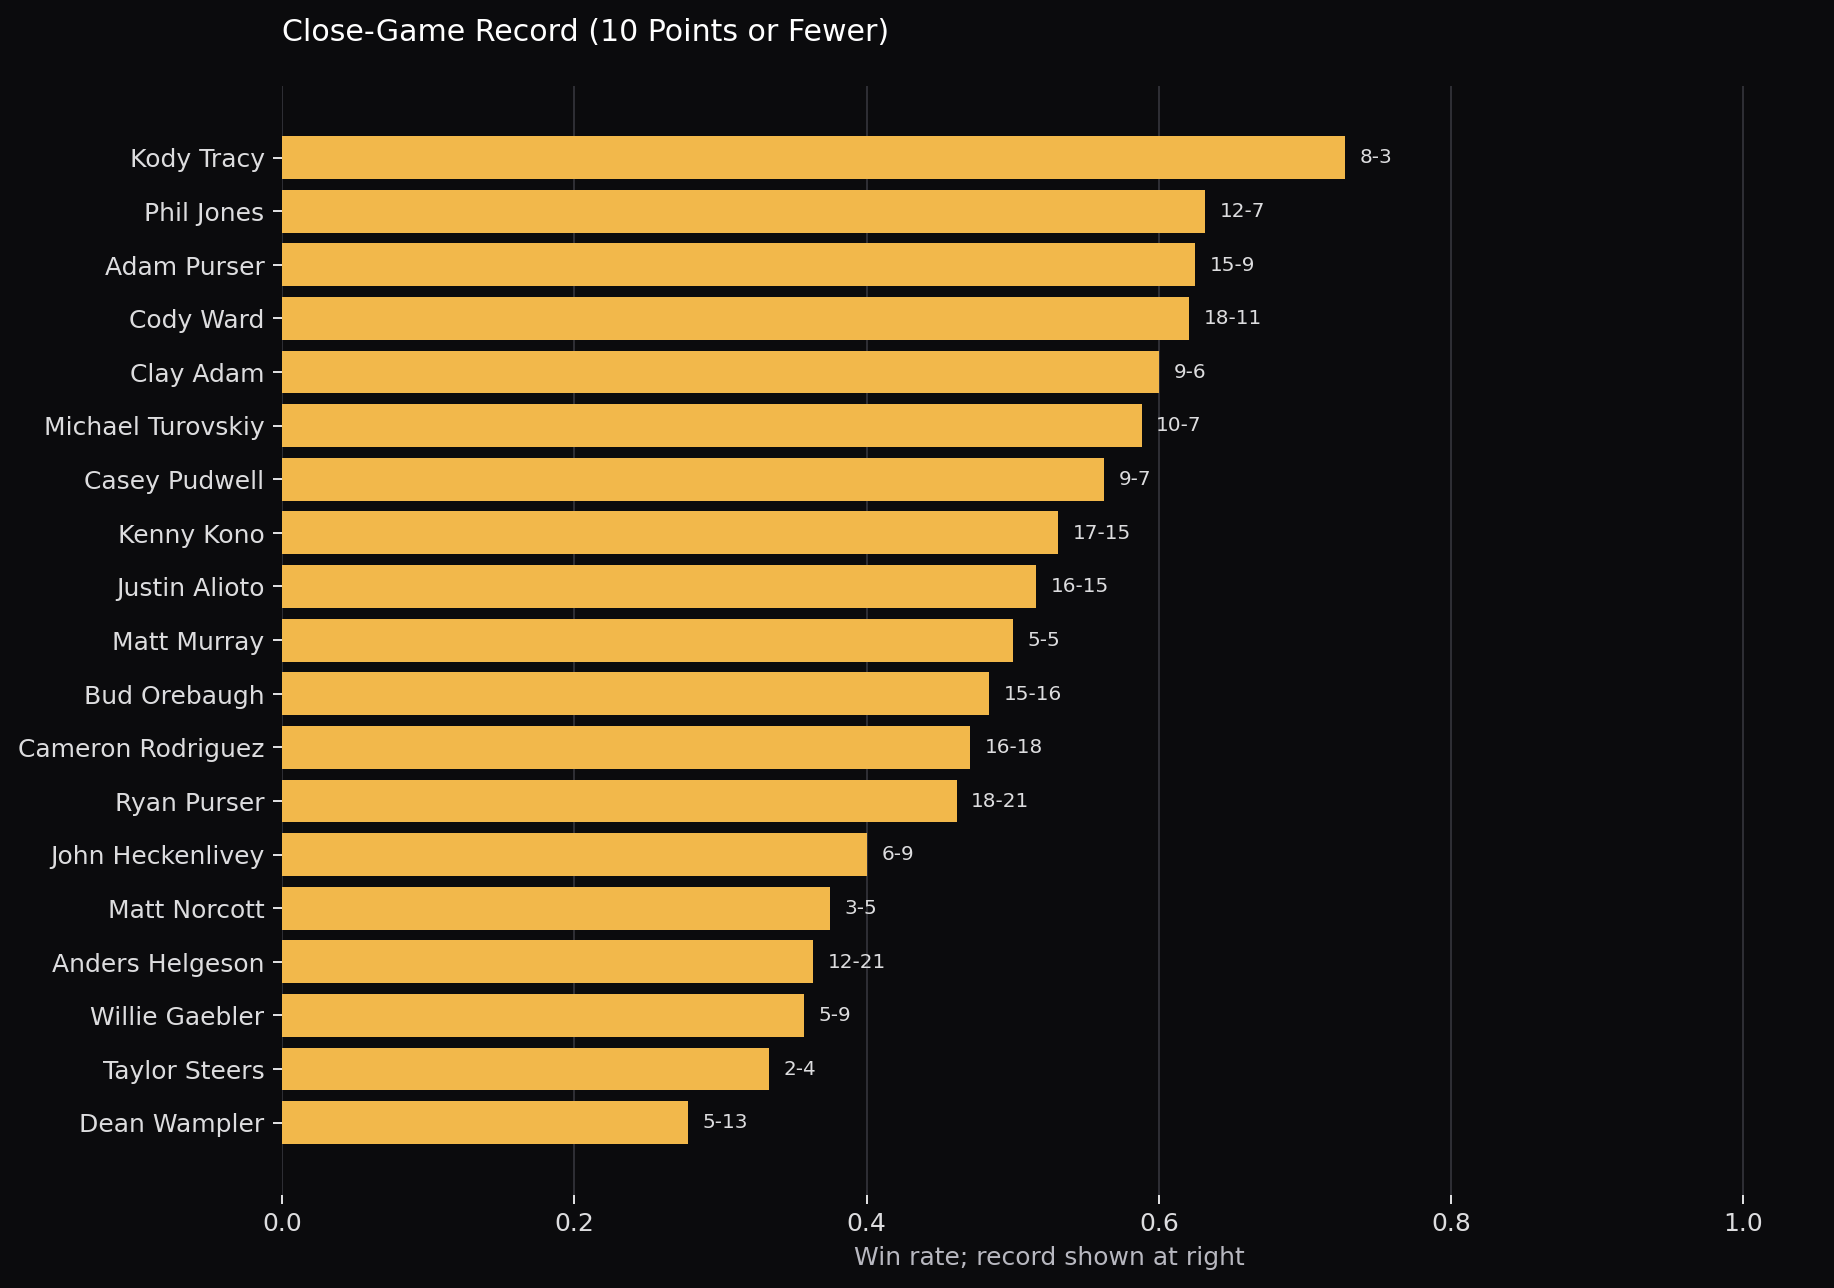
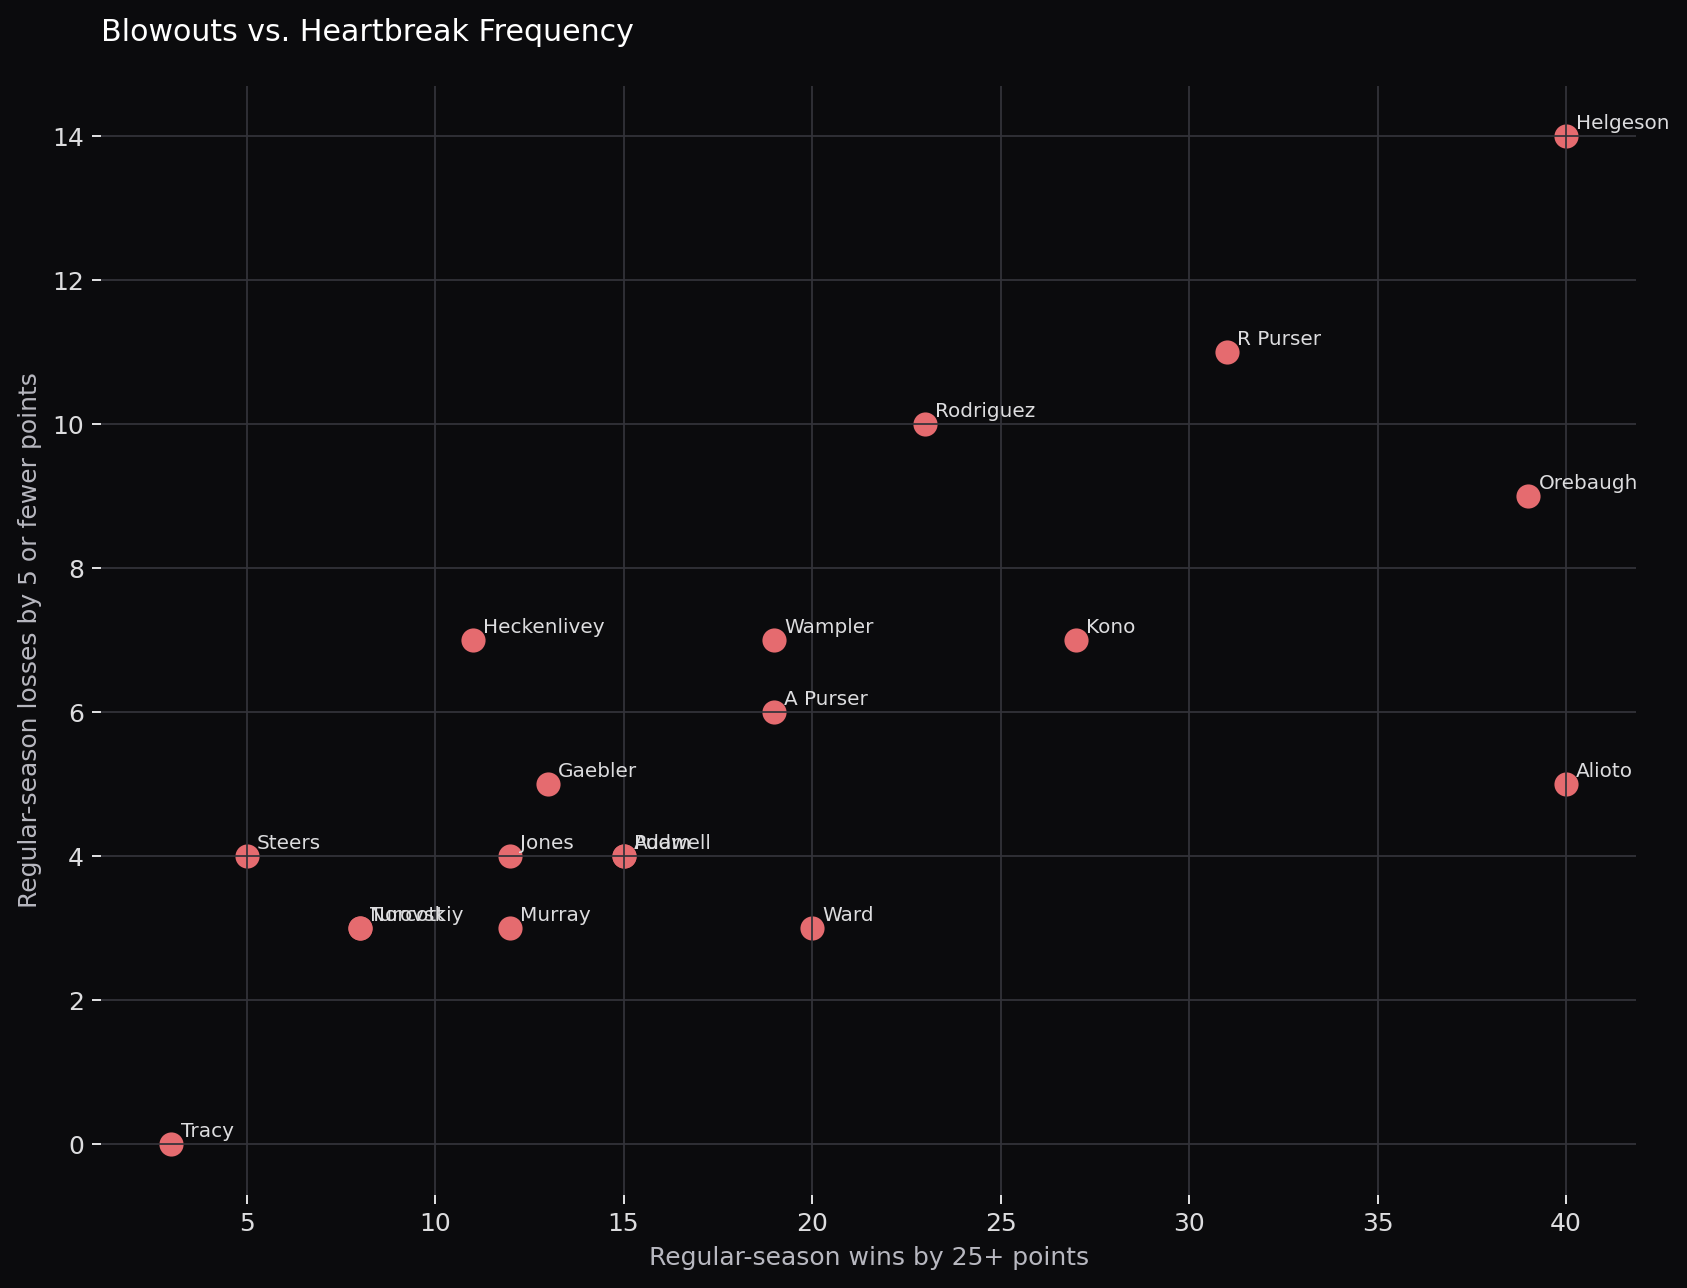
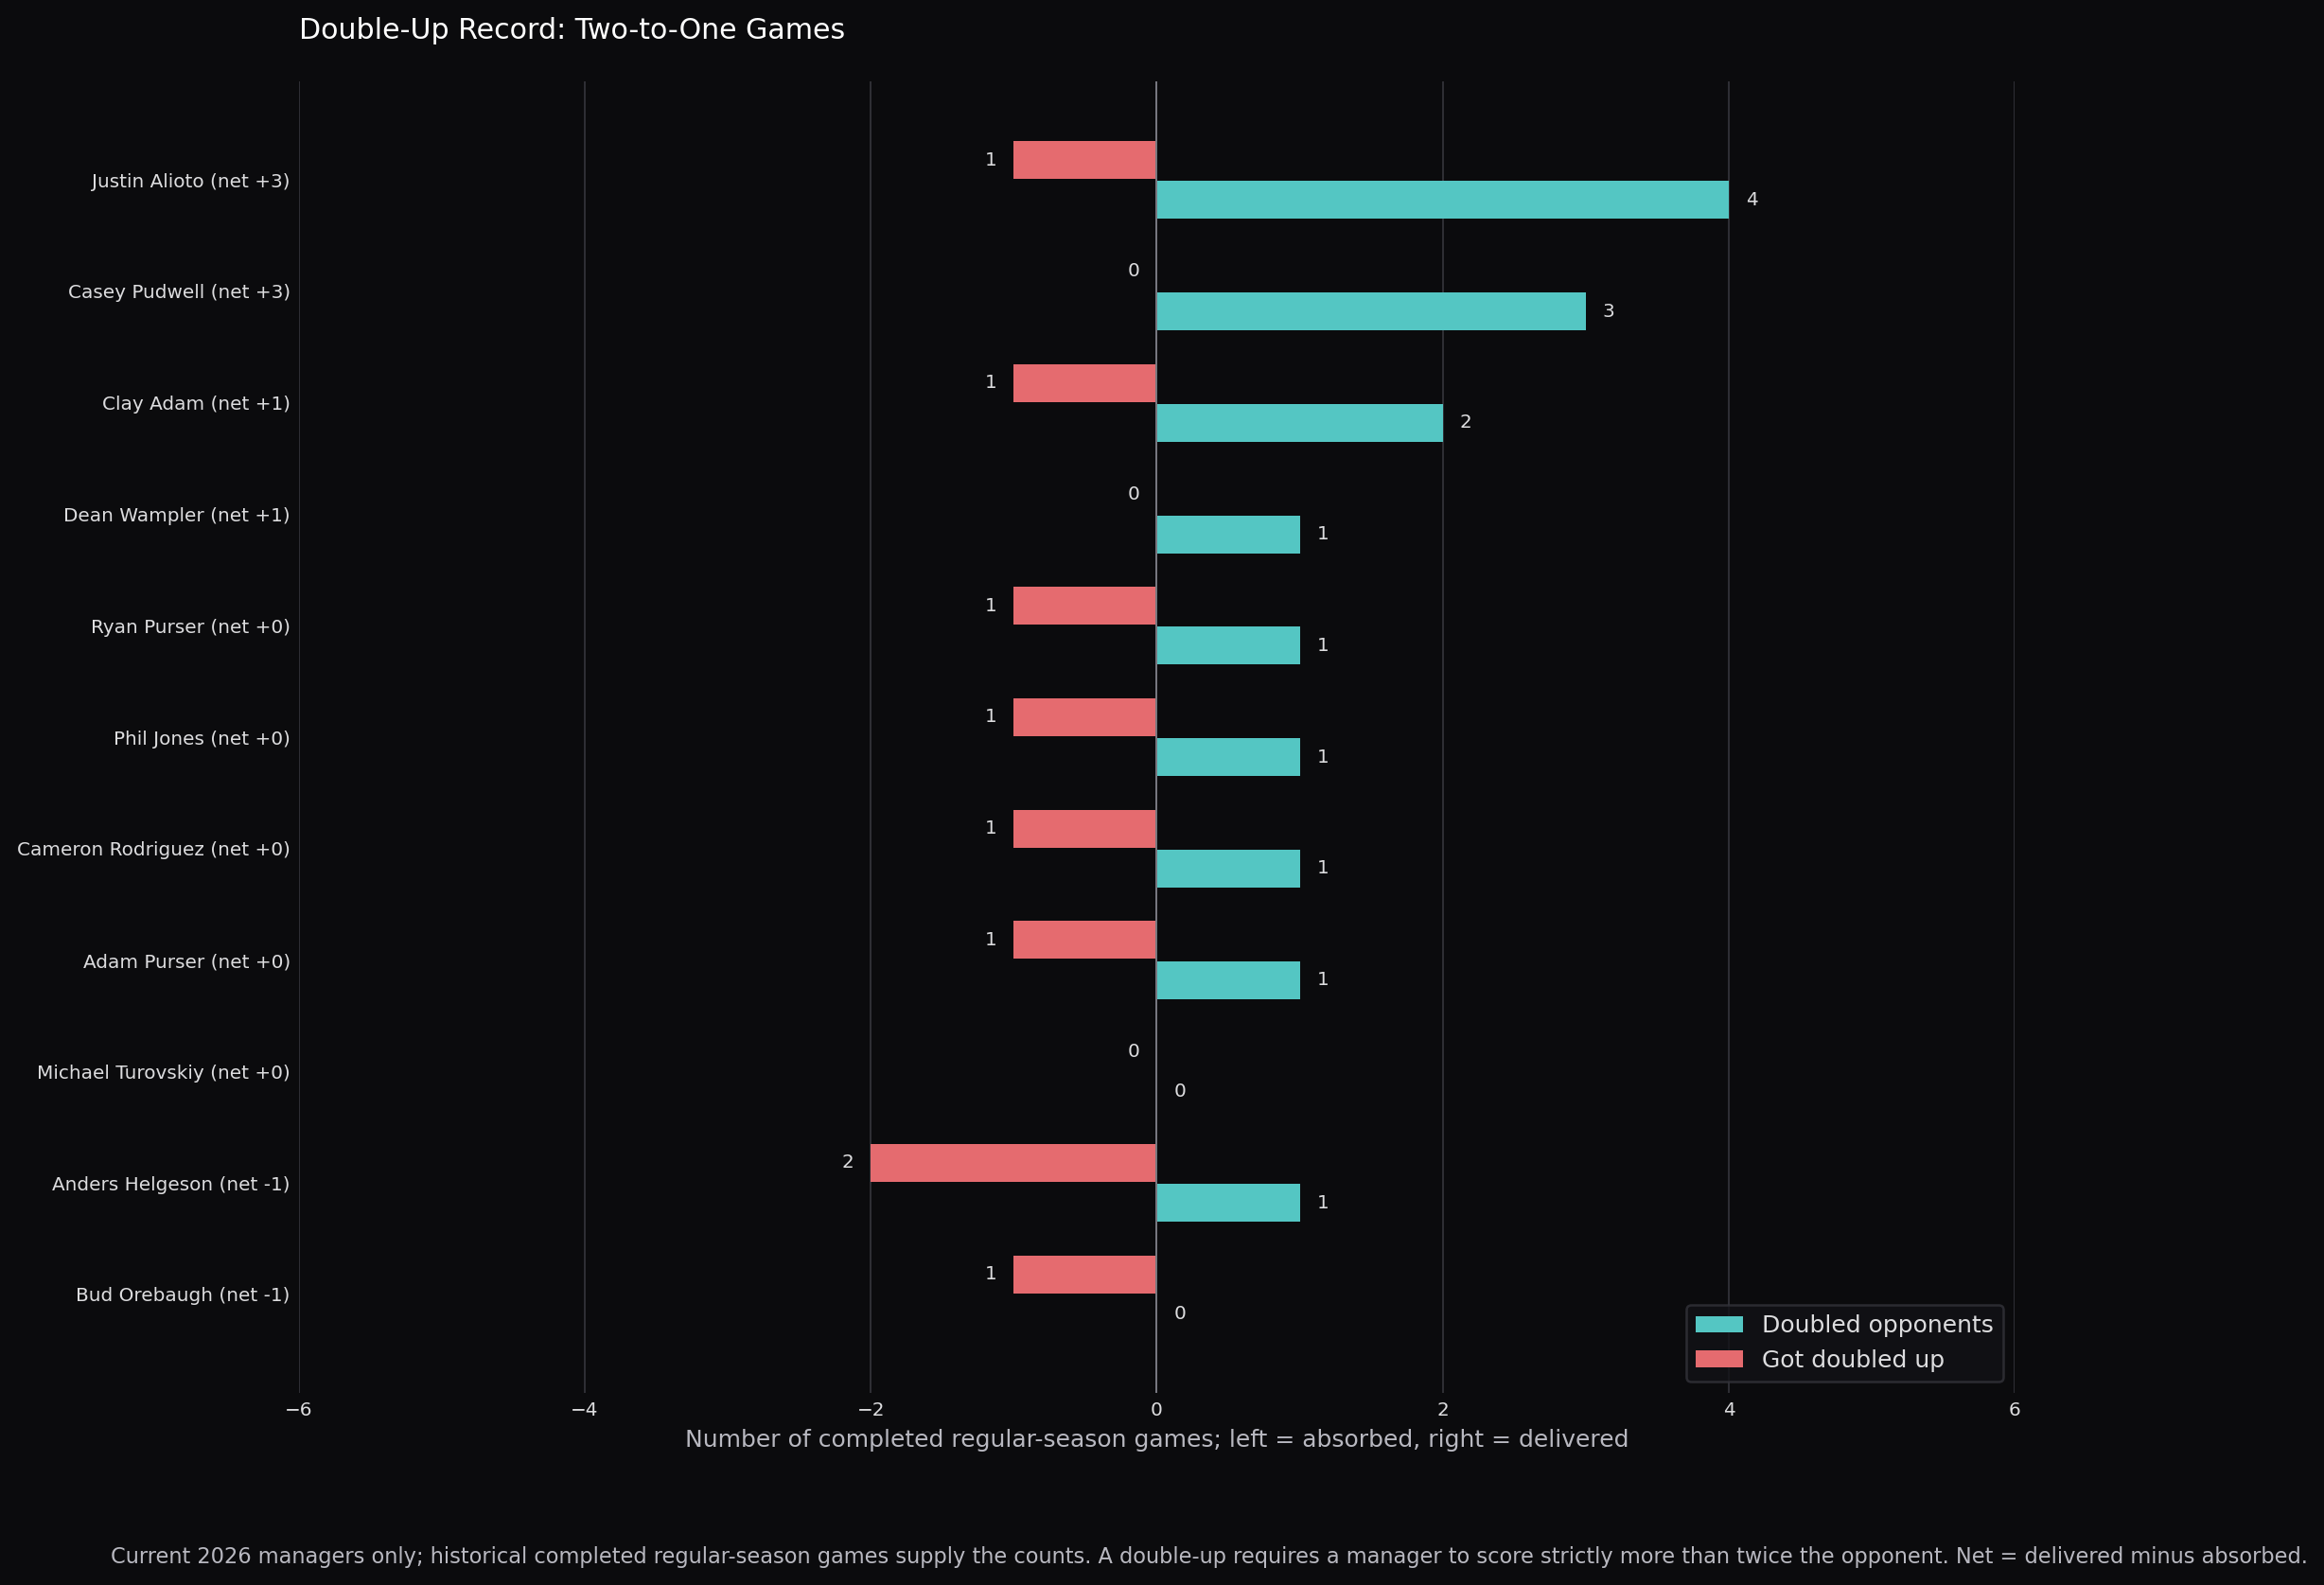
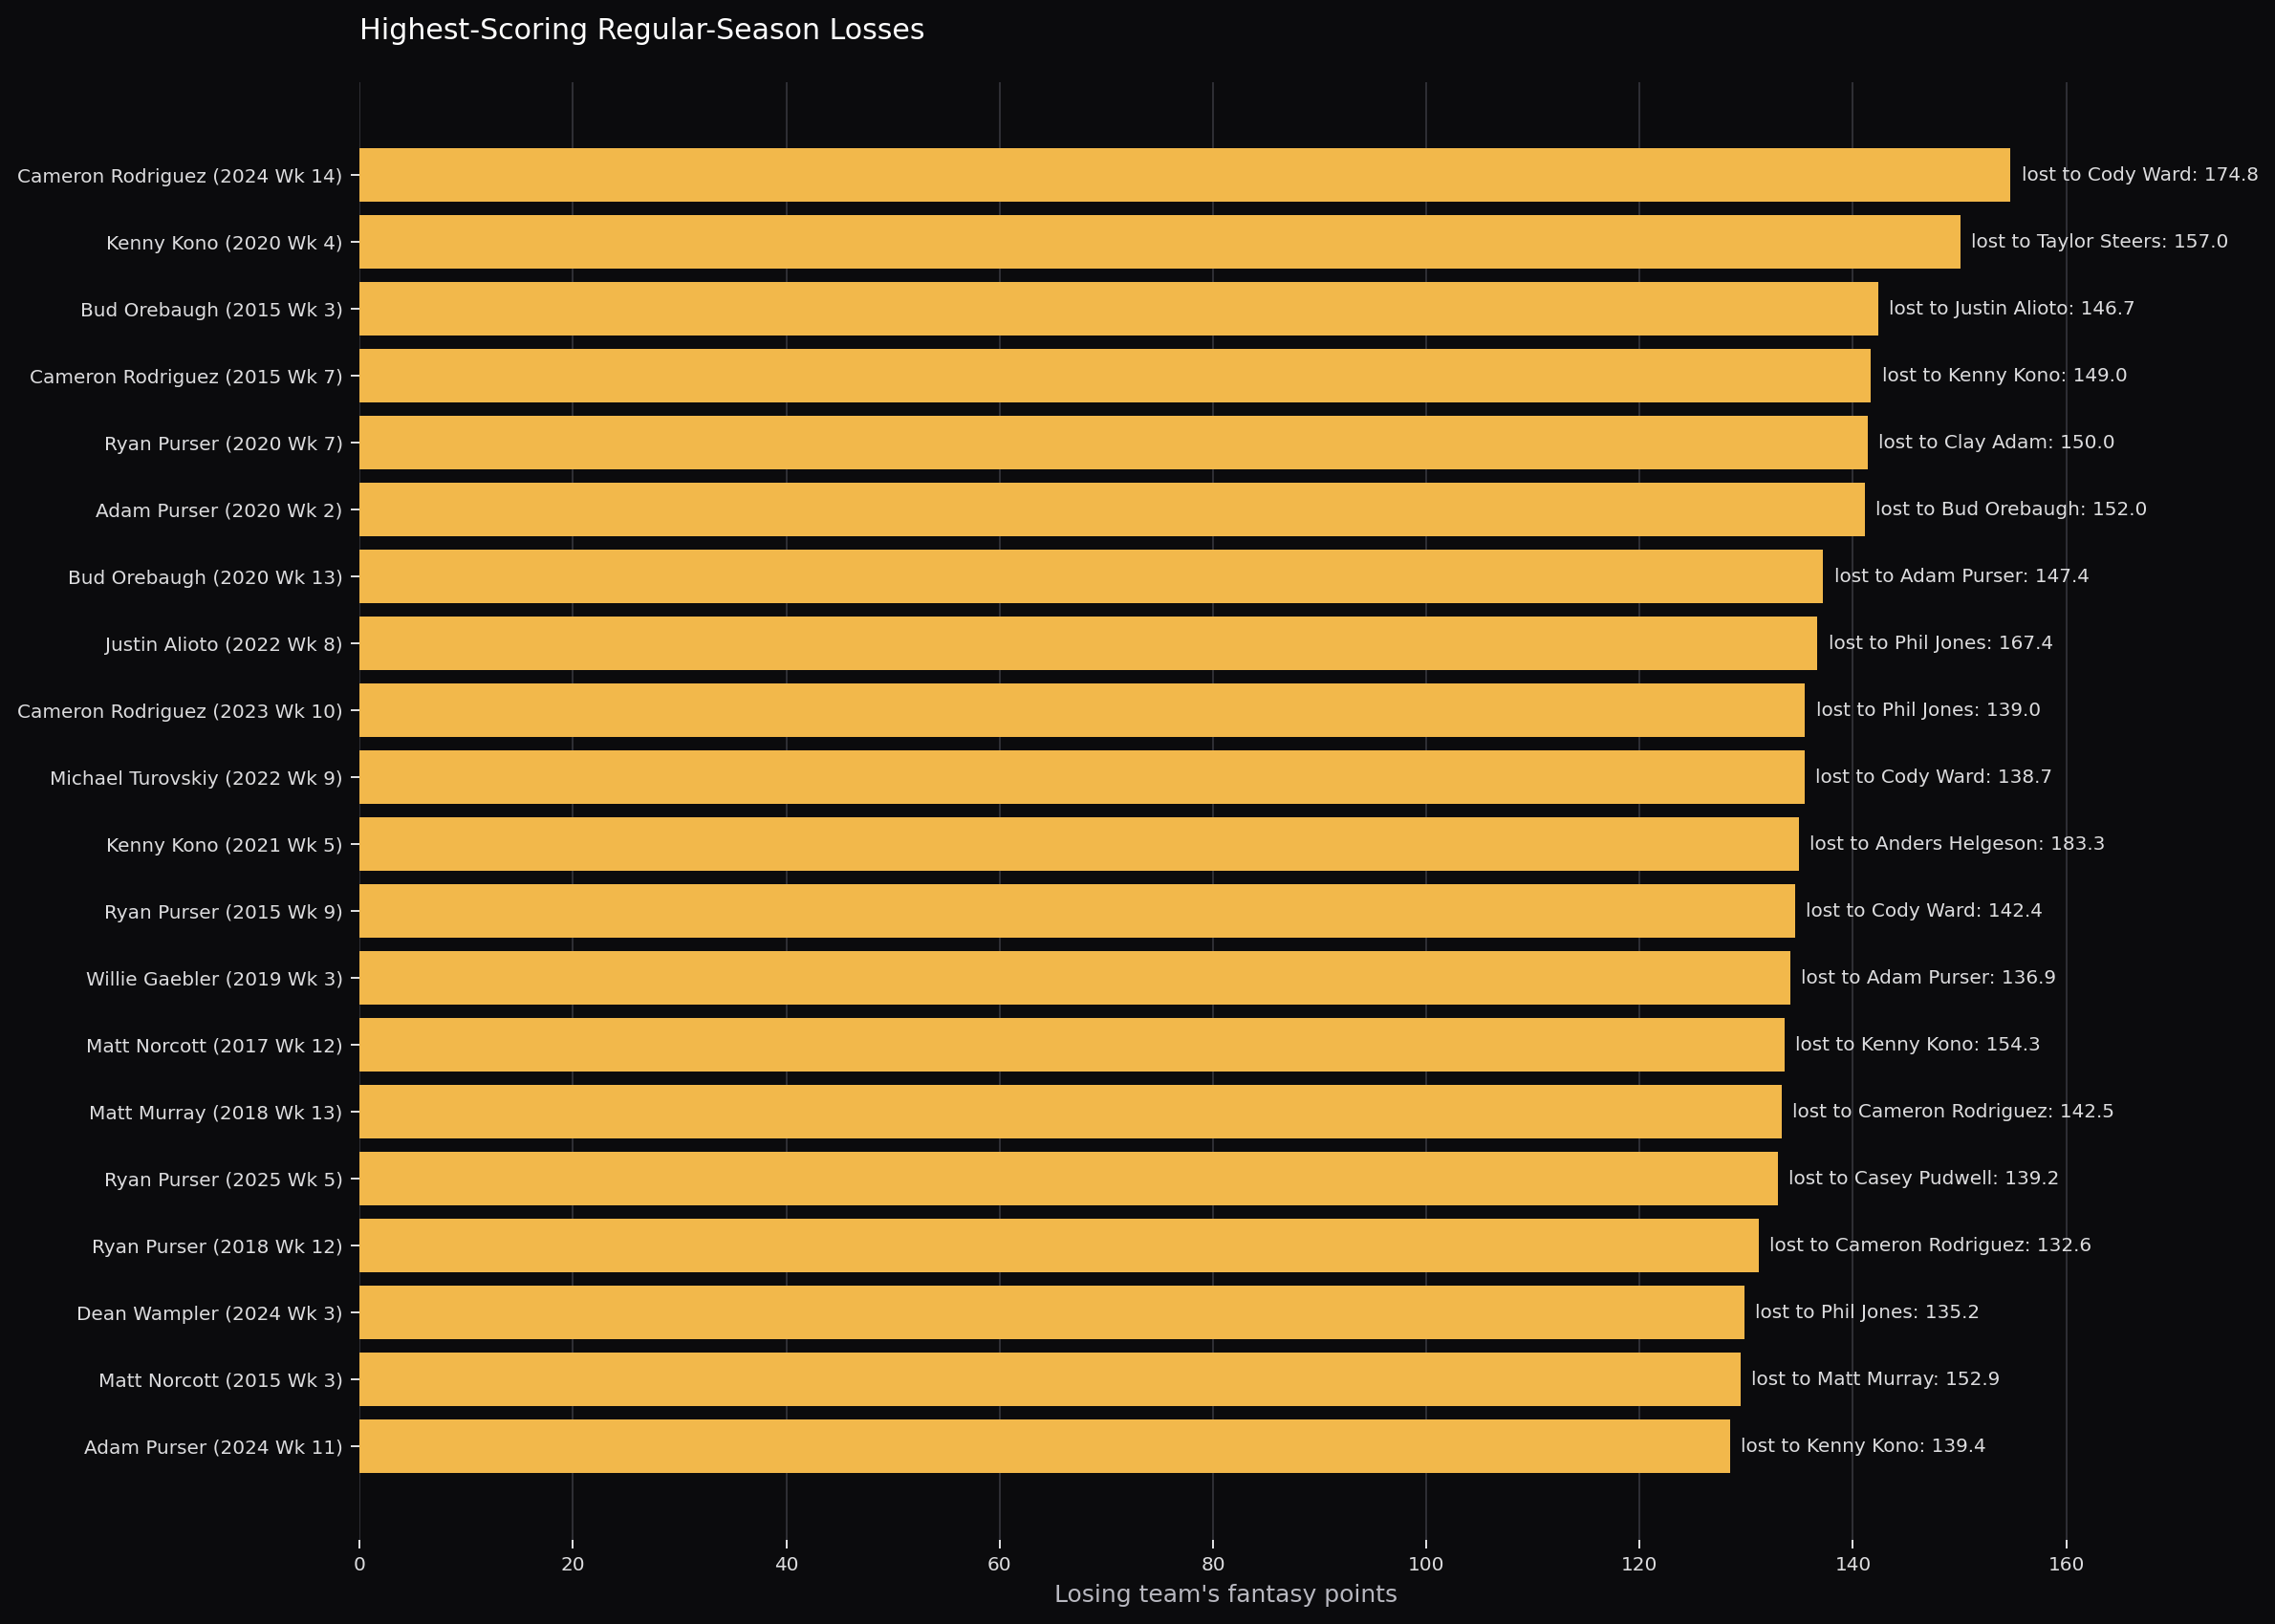
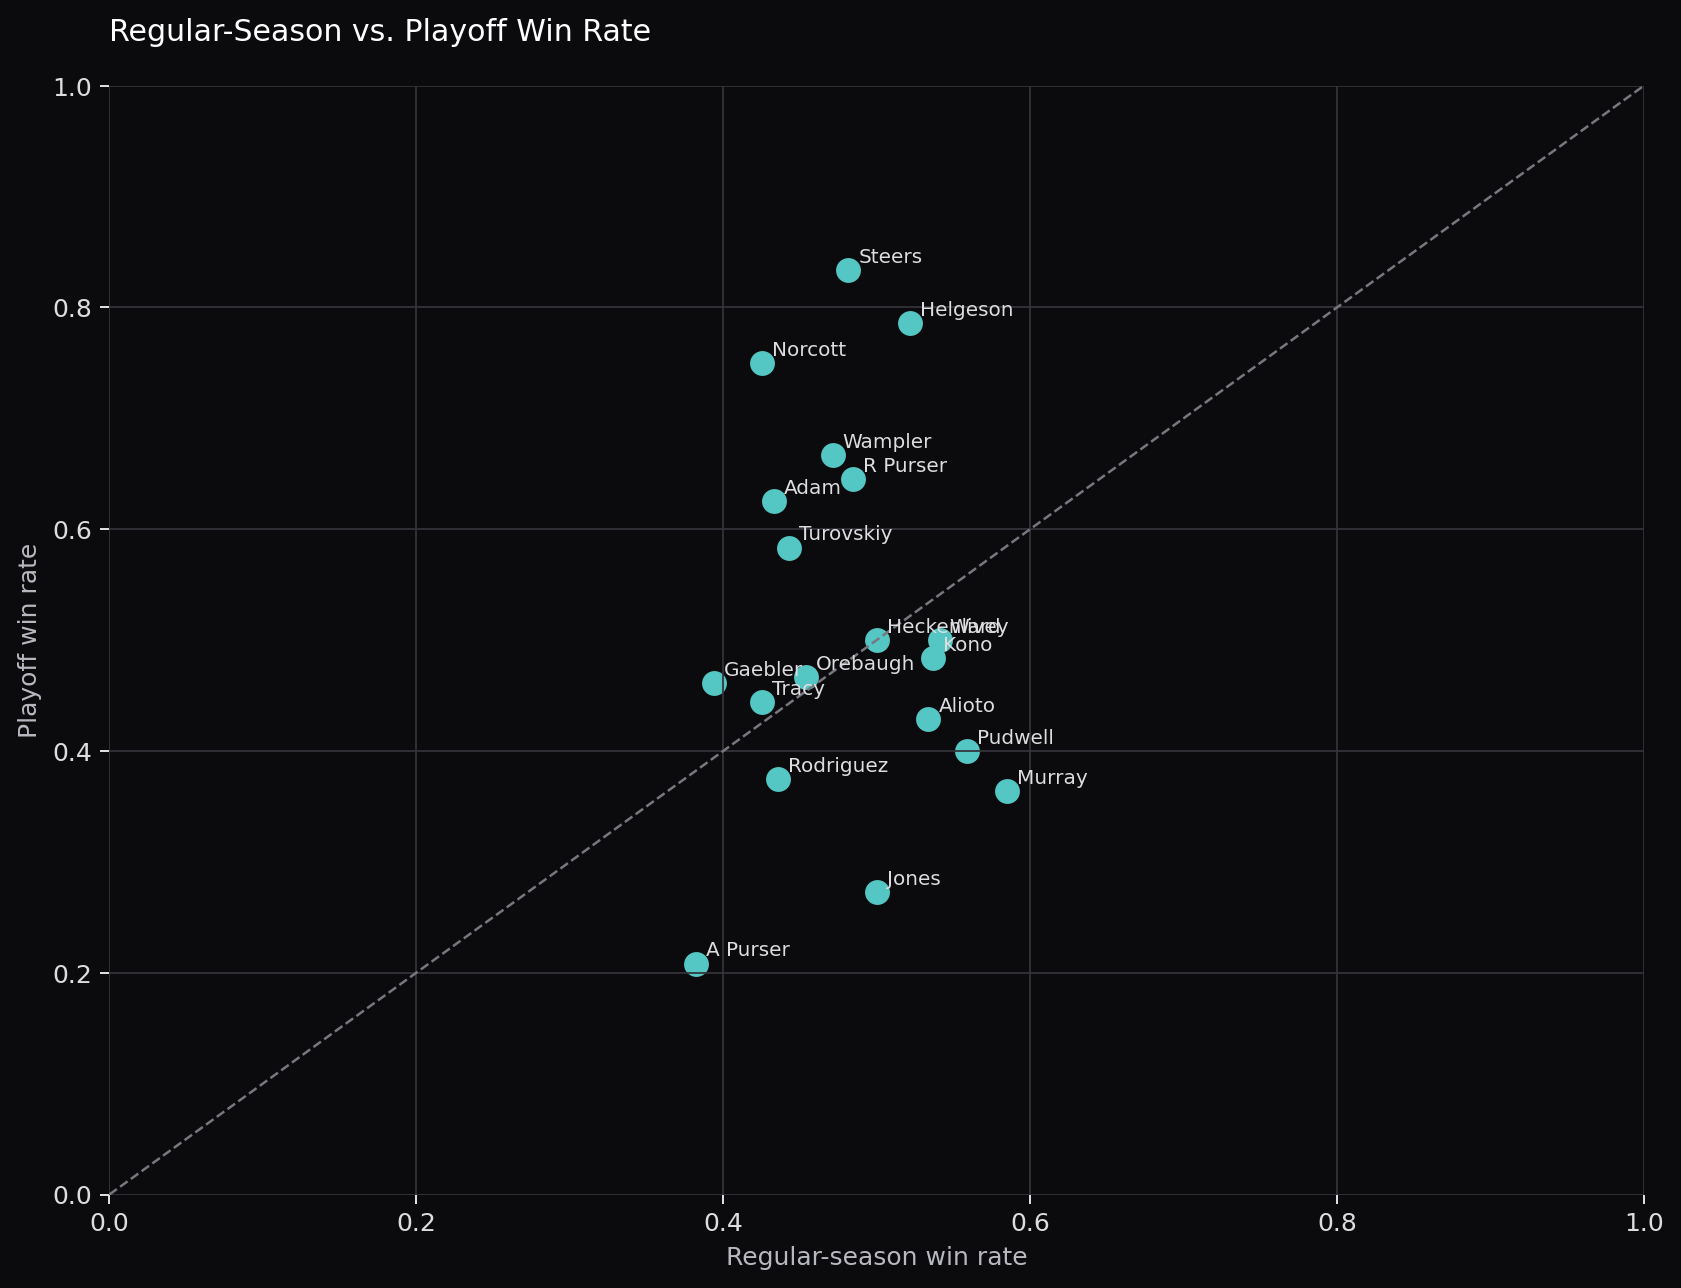
These views separate scoring strength from schedule luck, consistency, playoff translation, and the occasional spectacular collapse.
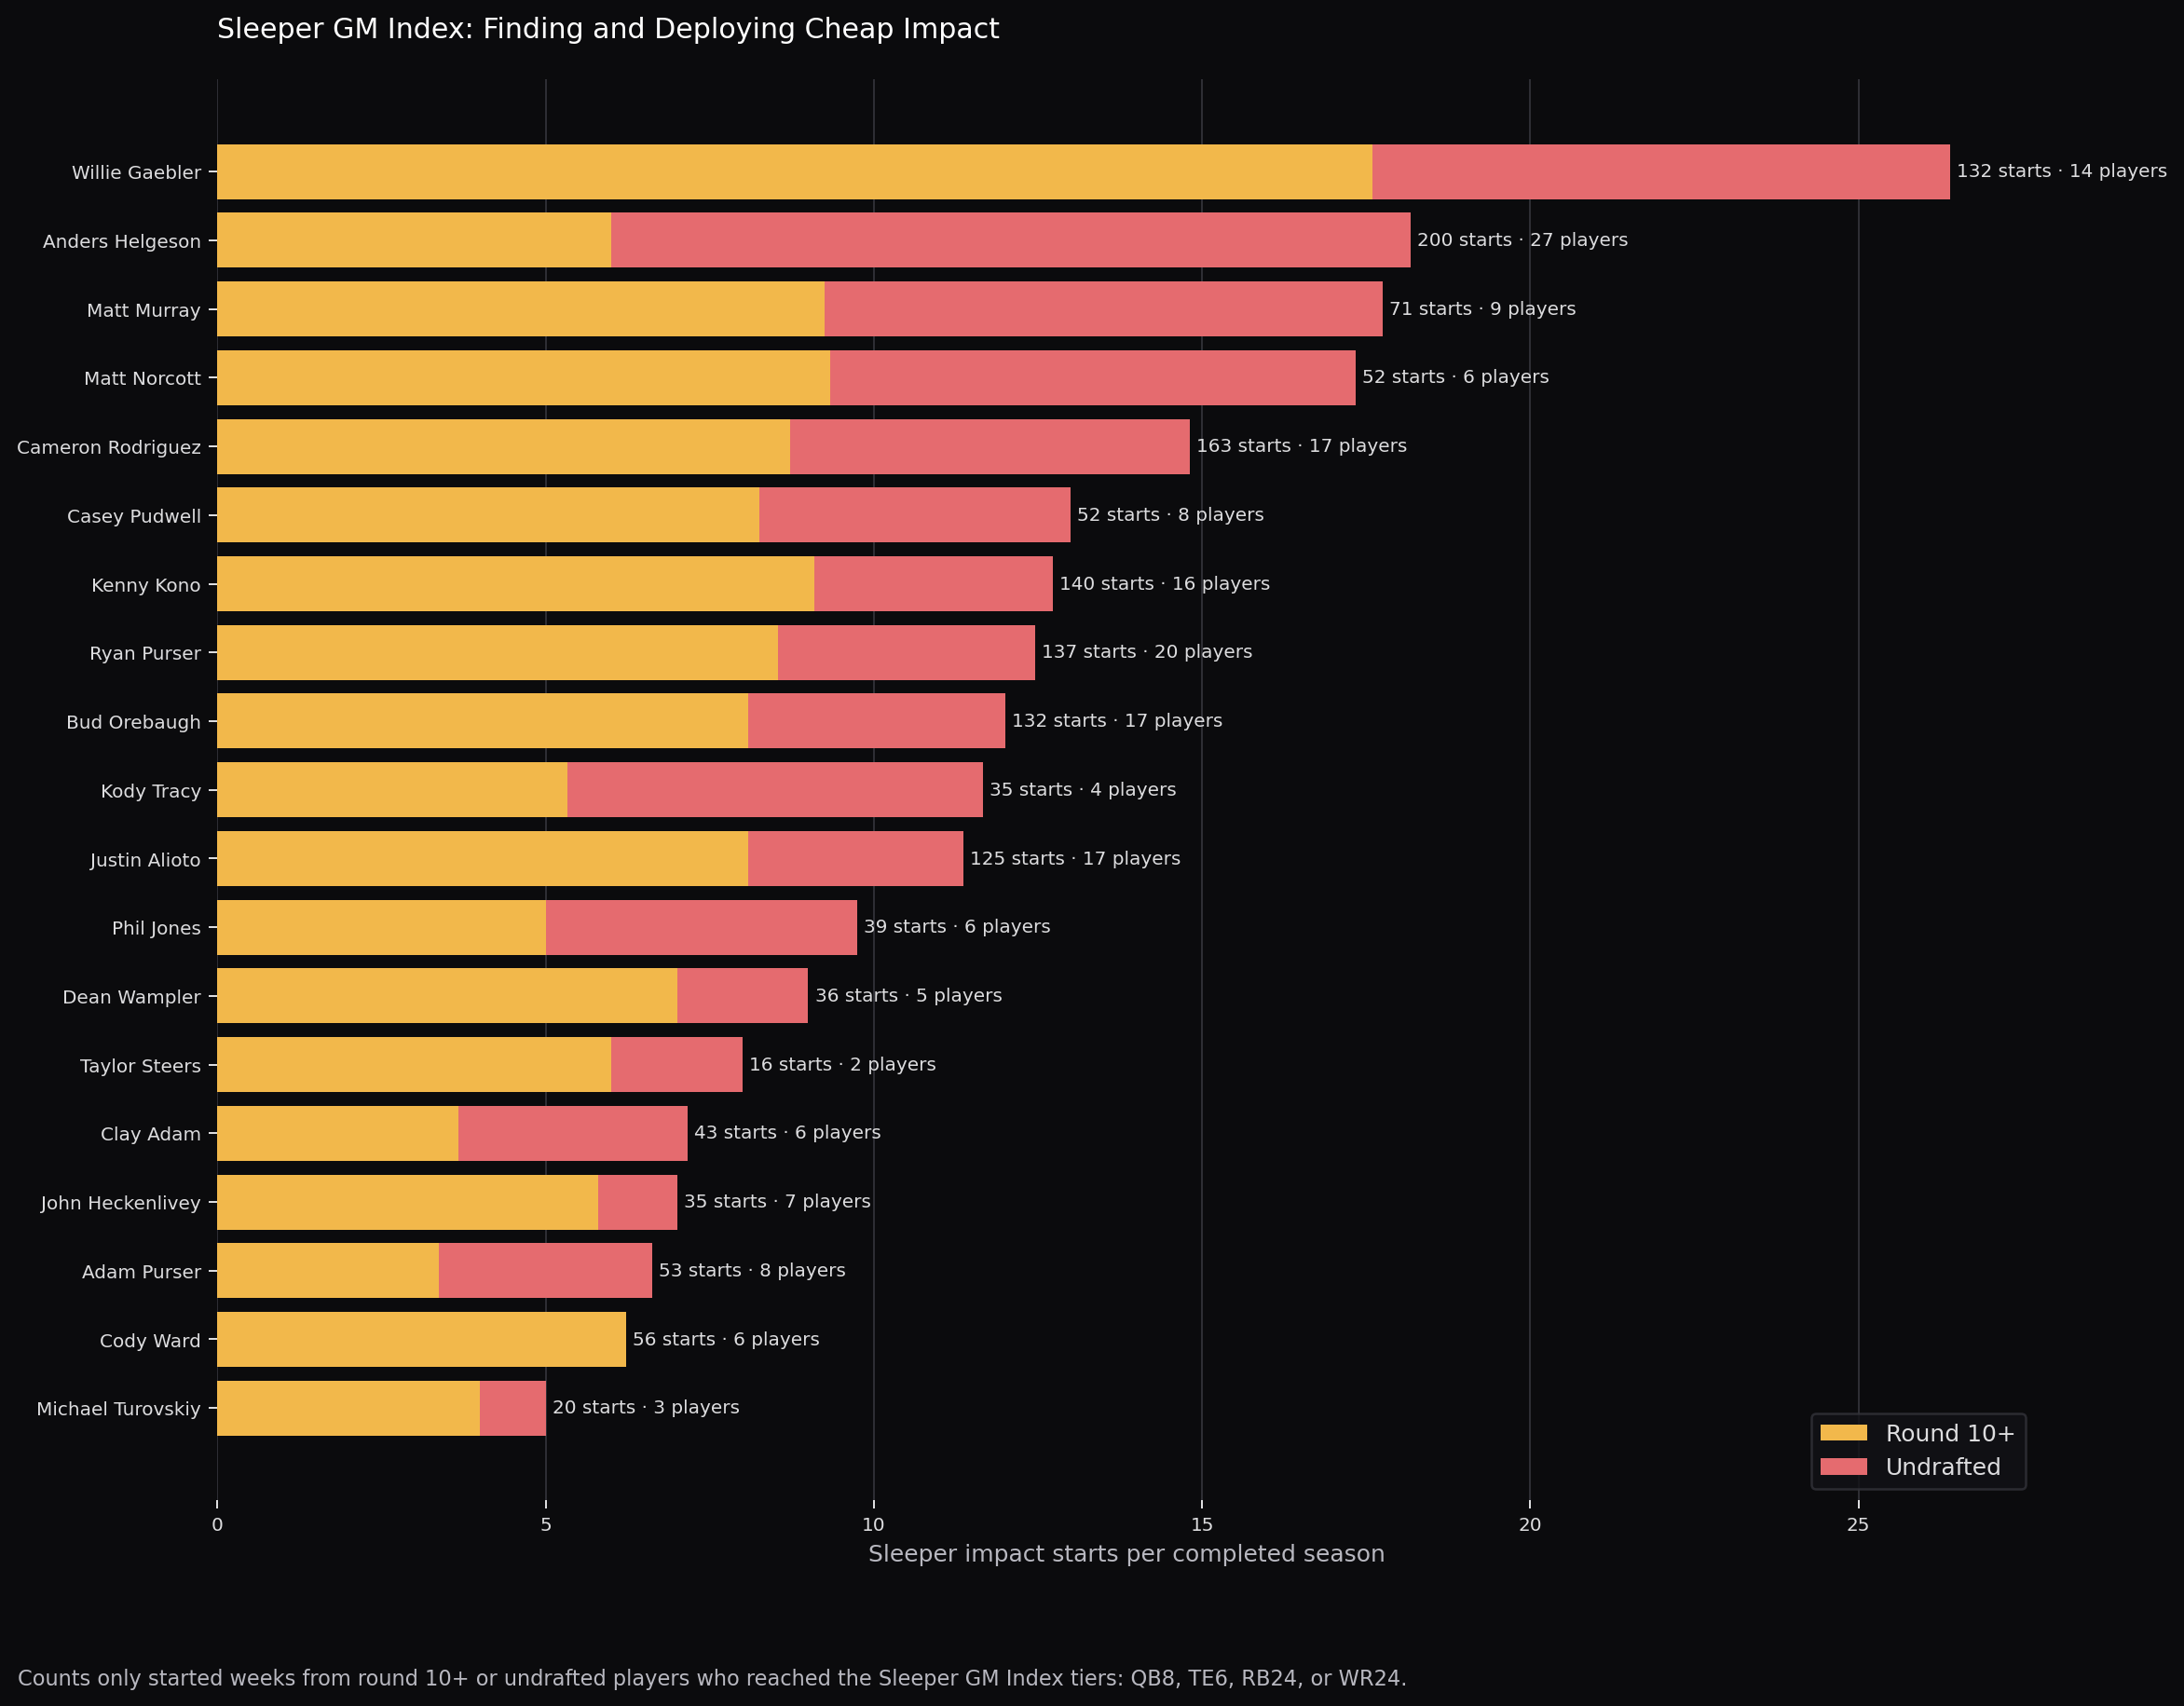
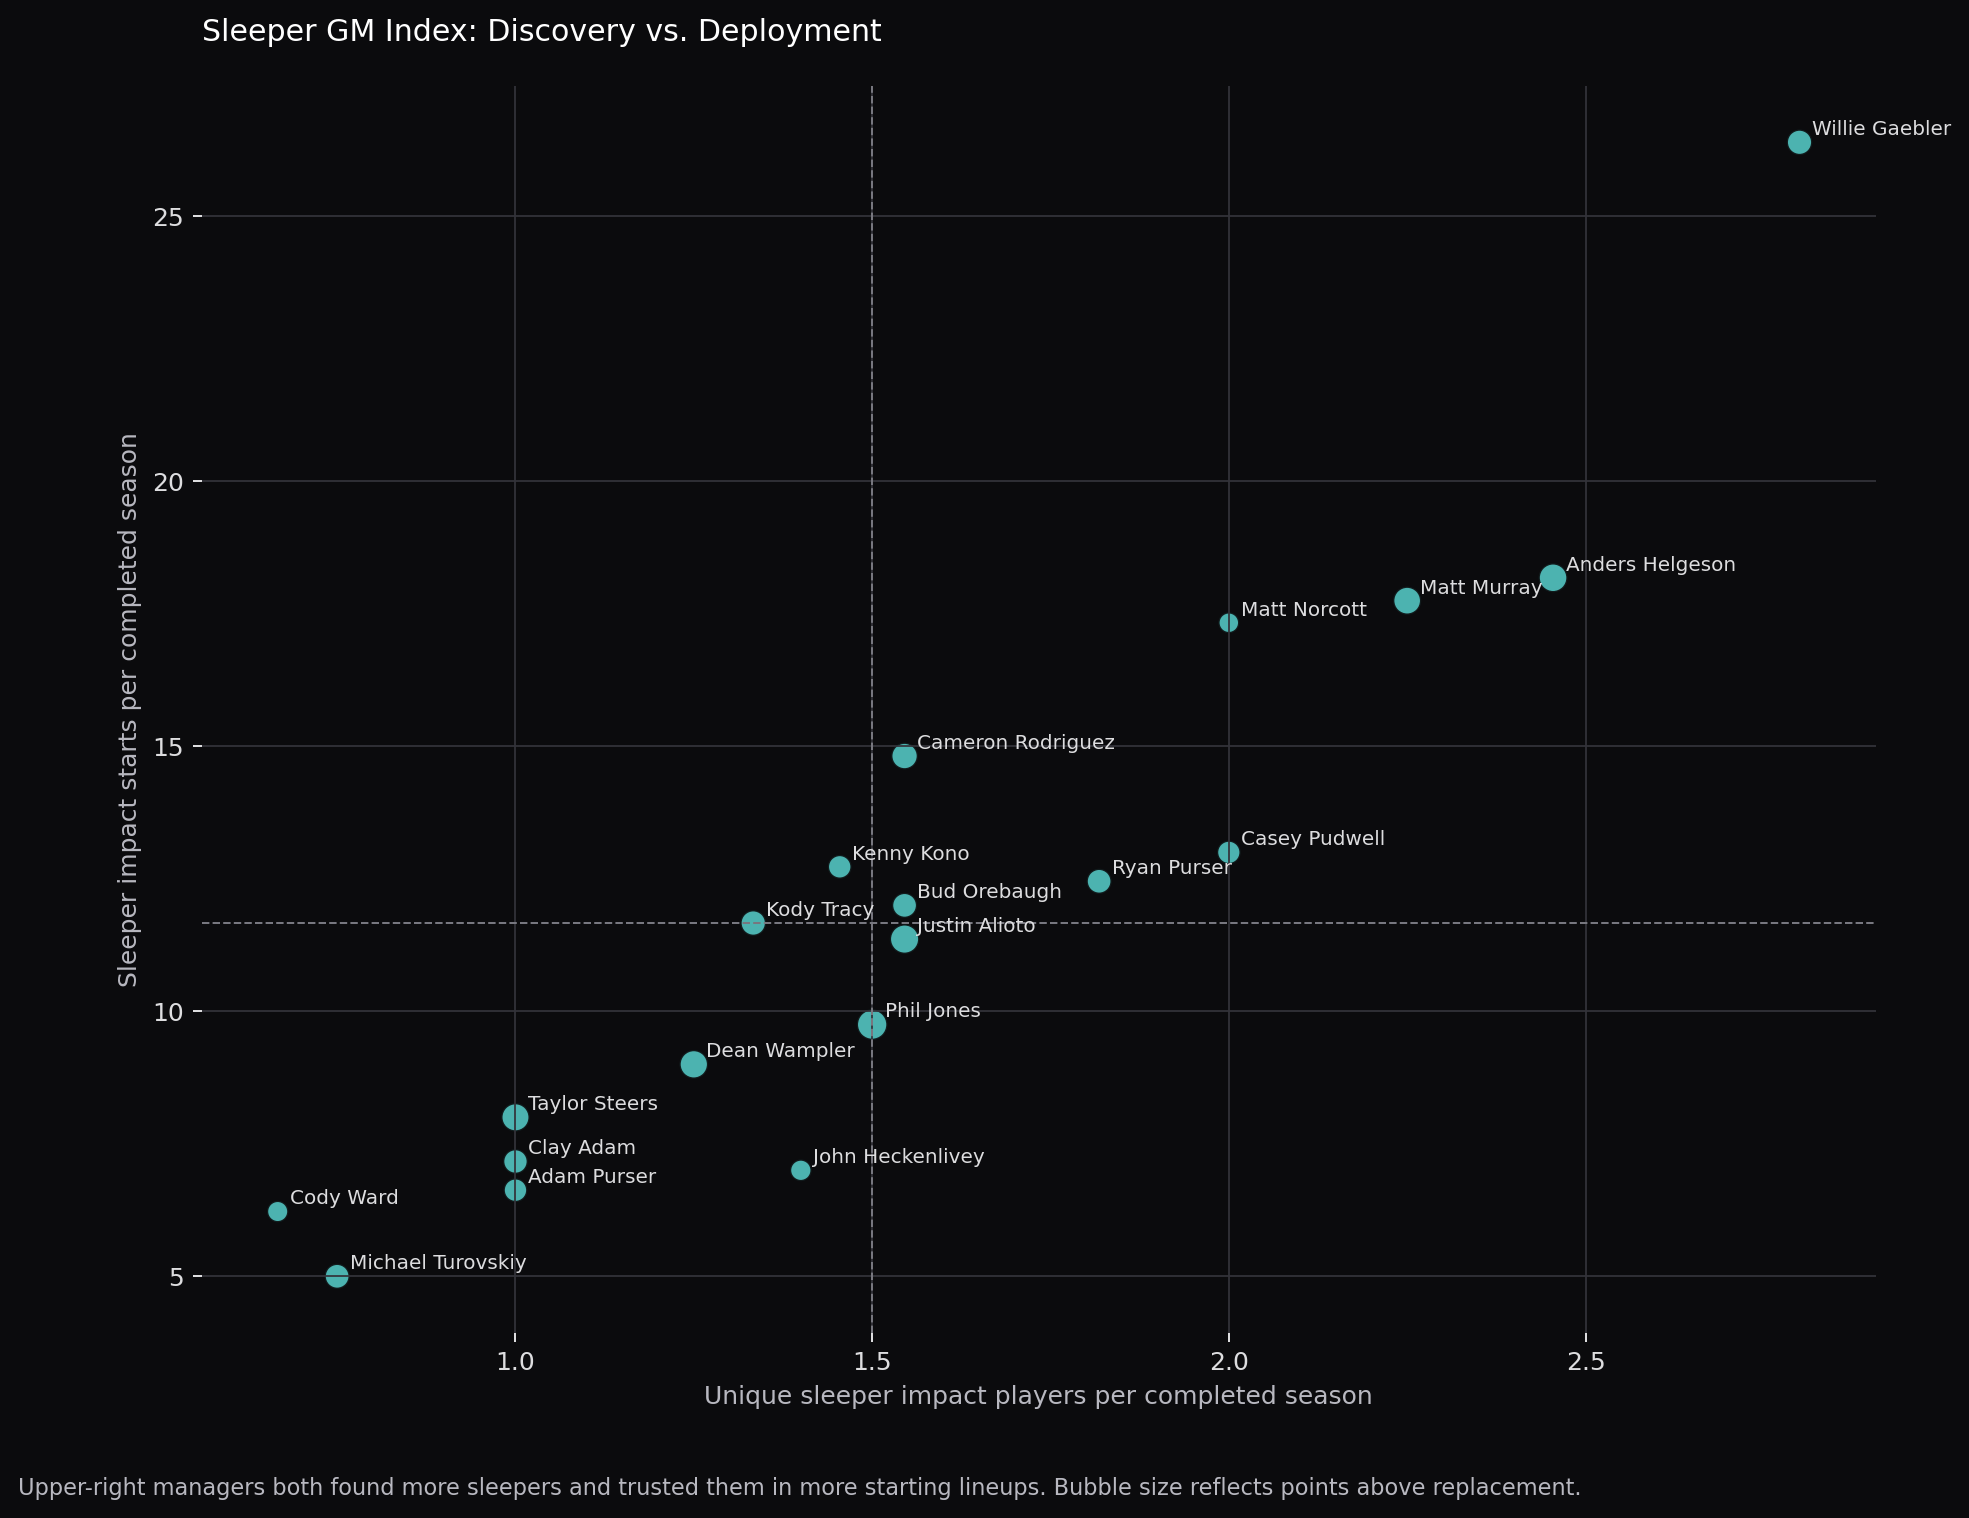
How to read the Sleeper GM Index
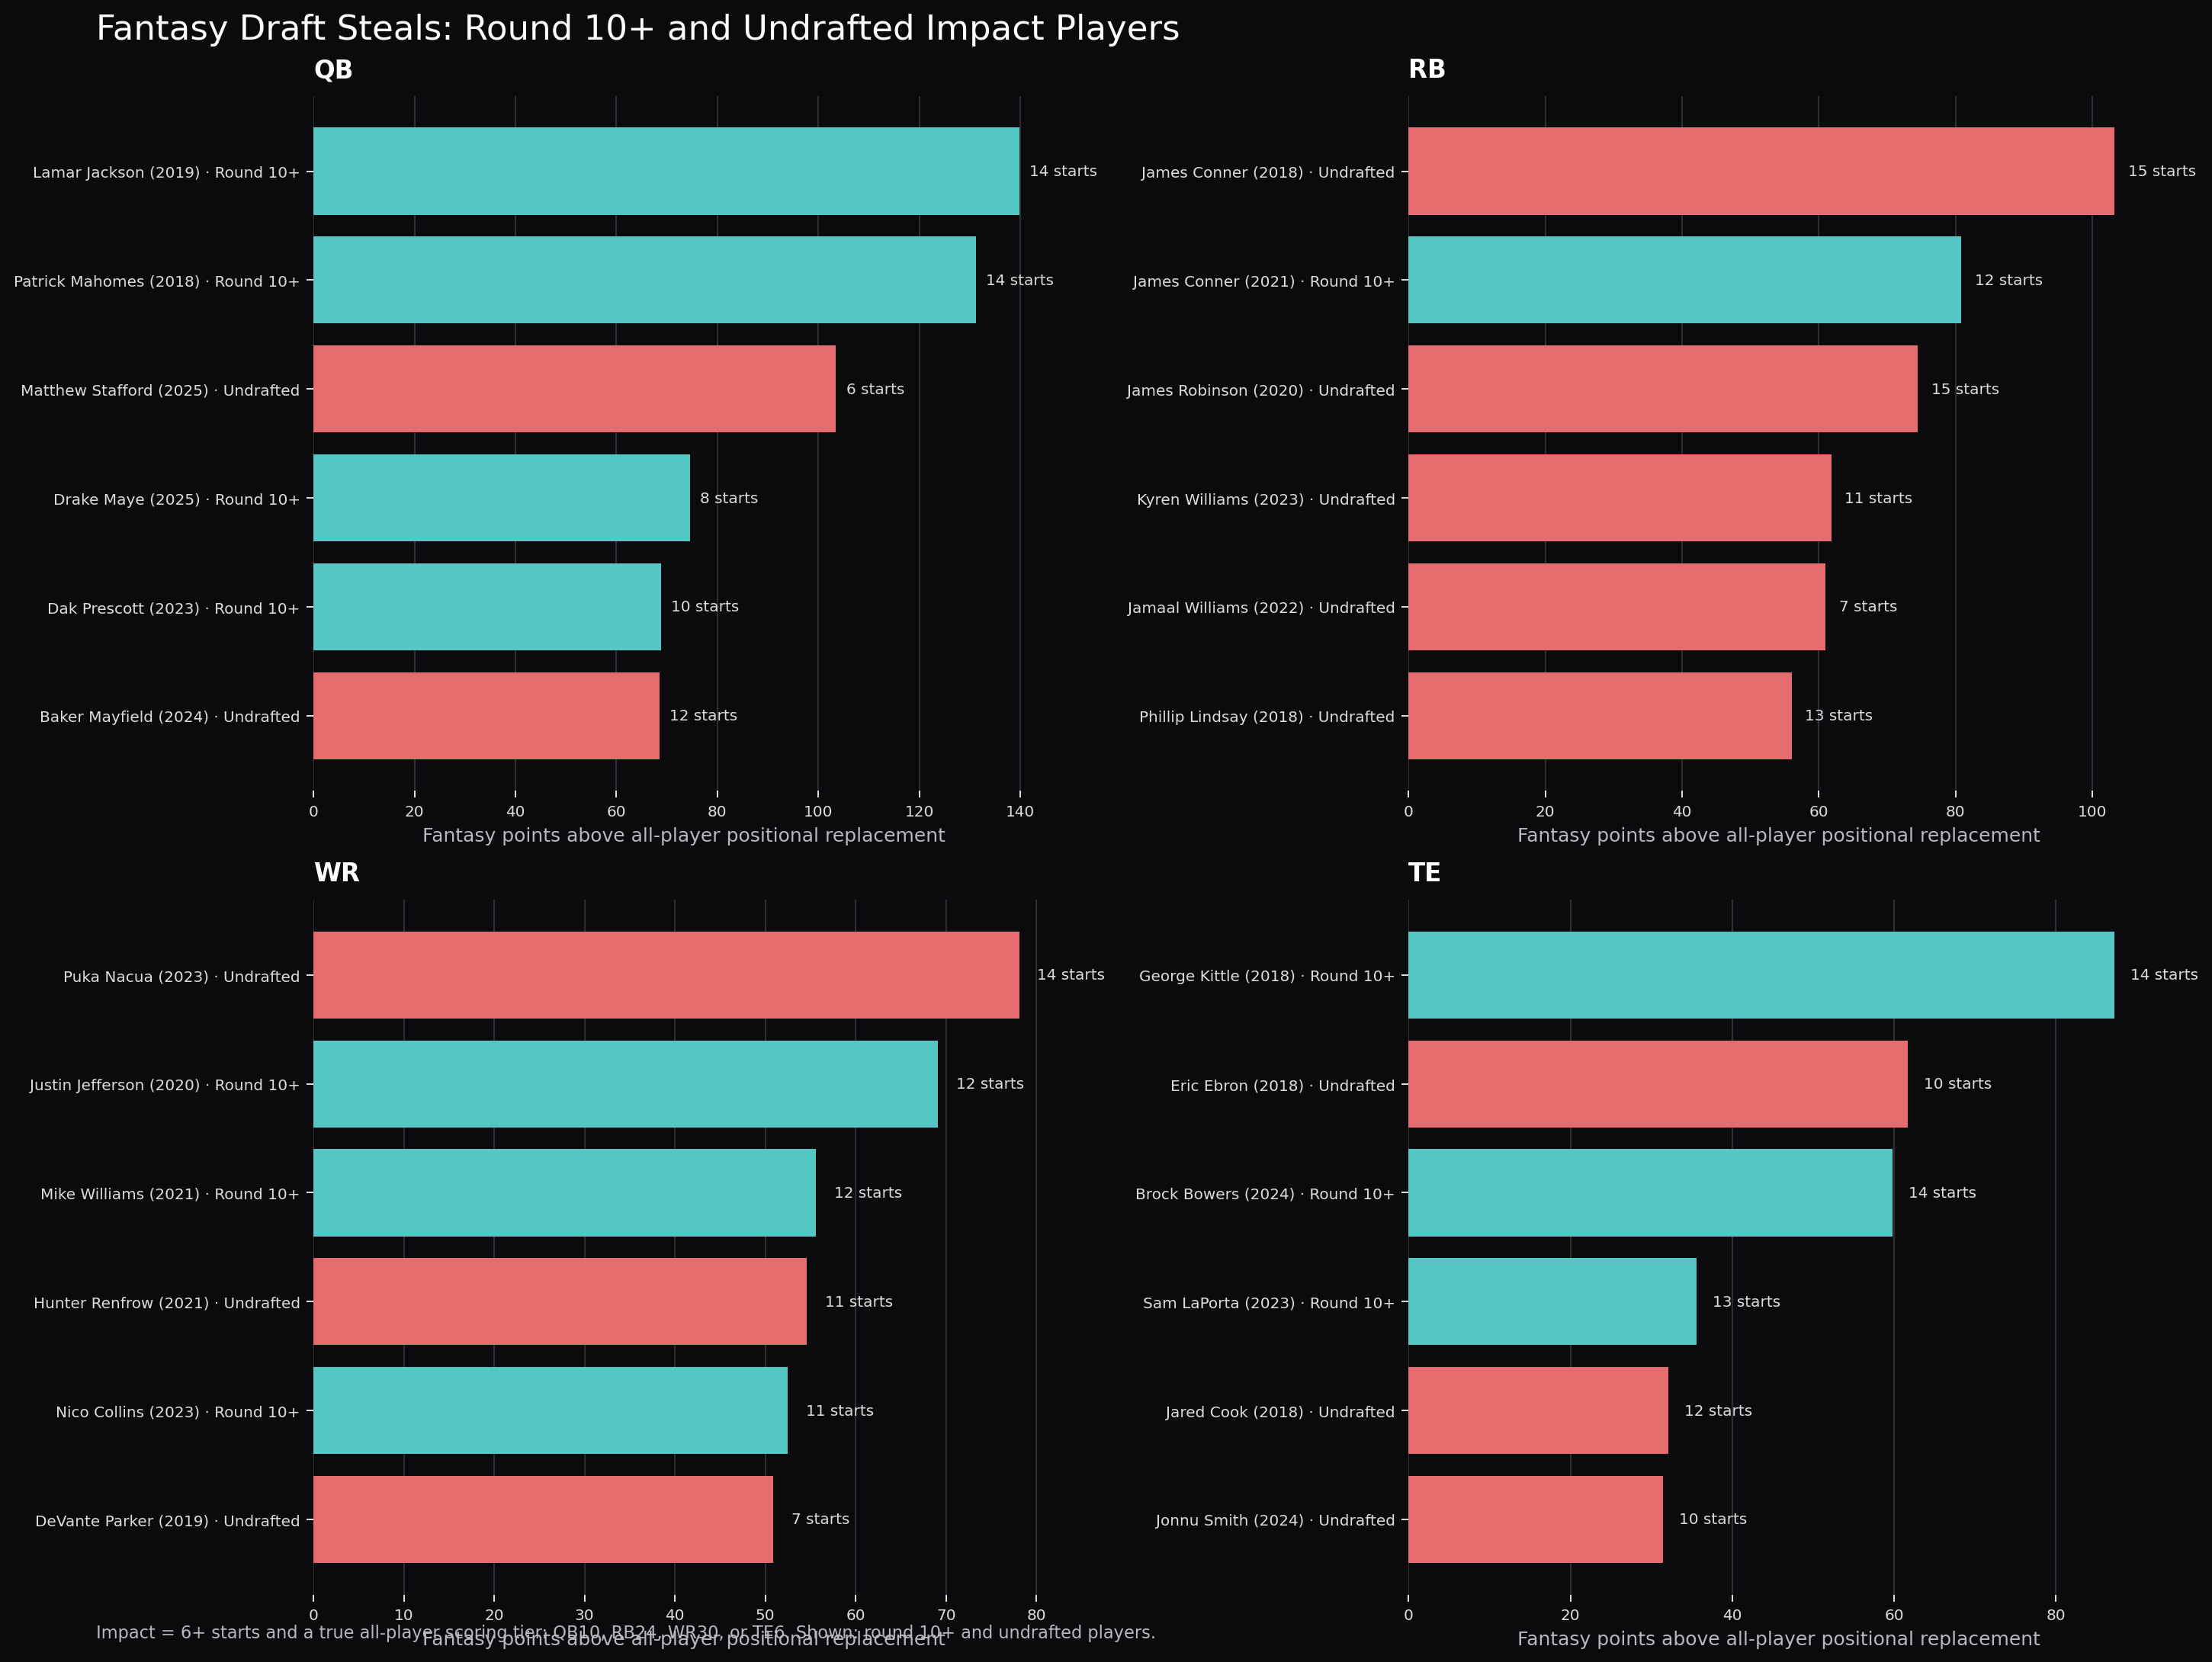
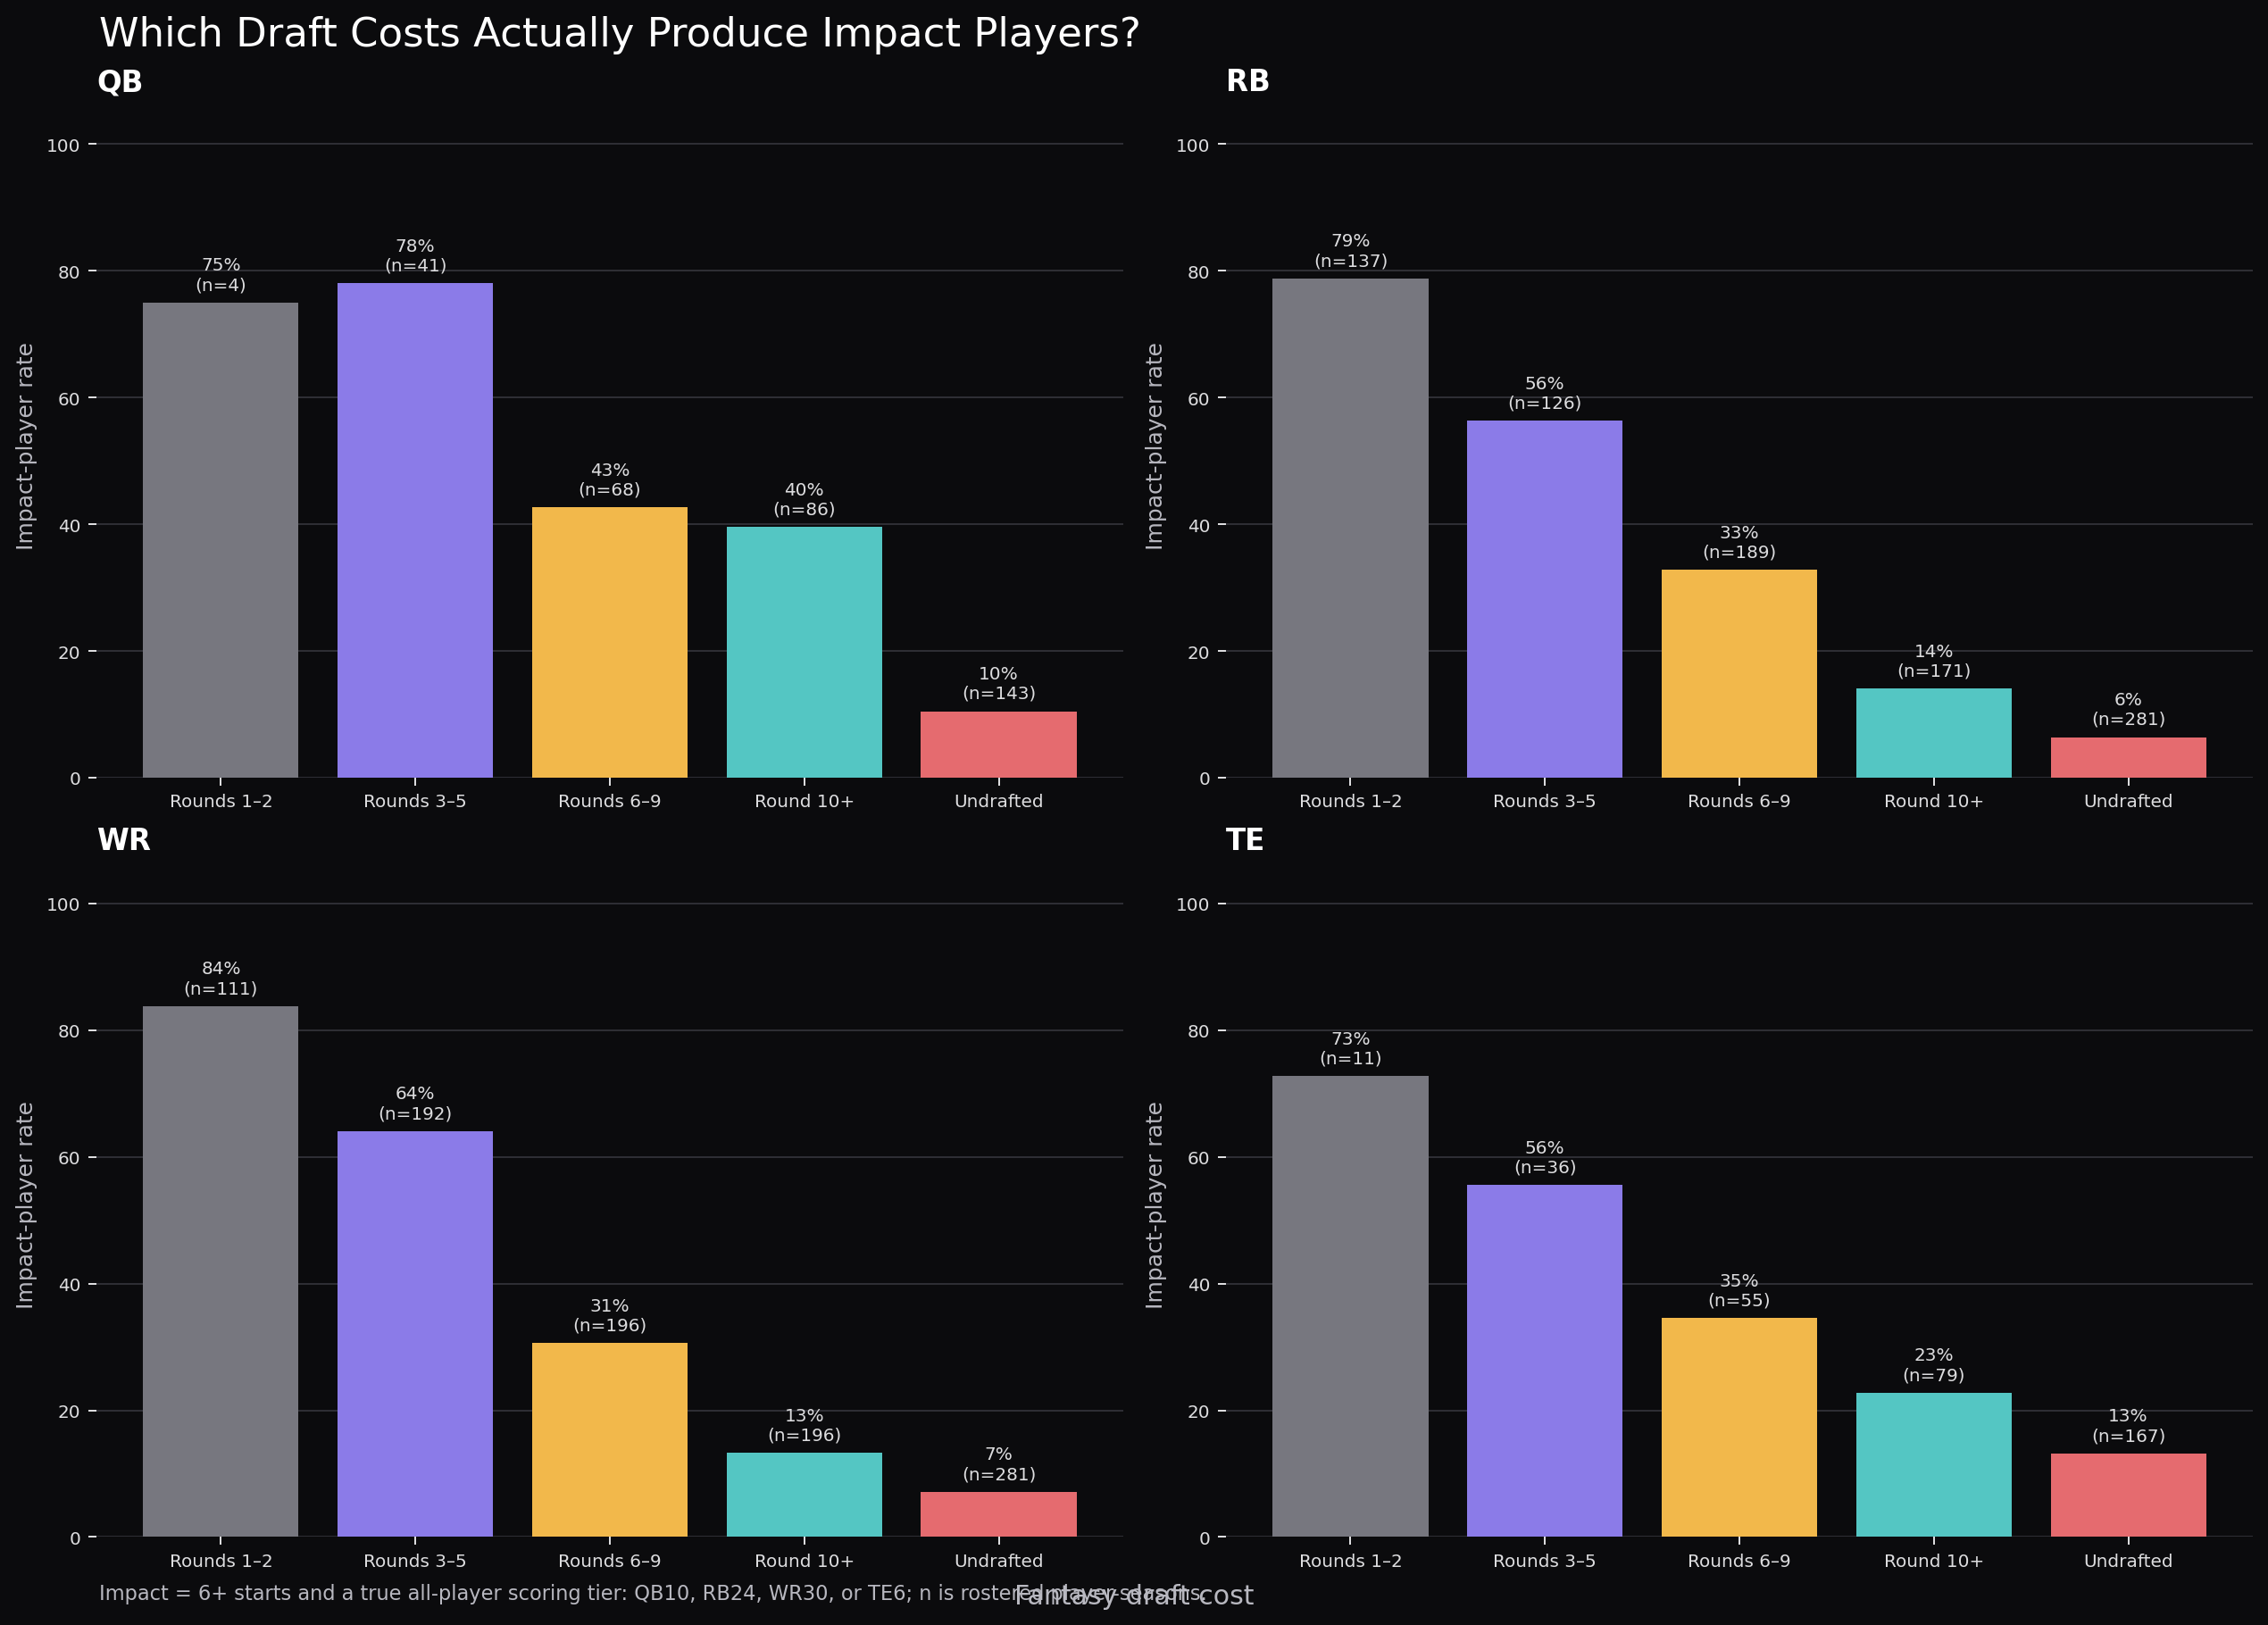
A sleeper is a player who was either drafted in round 10 or later or went undrafted, then became a genuine impact player: at least six starts and a finish inside the position-specific tier of QB8, TE6, RB24, or WR24.
Those positional ranks and replacement lines come from the scoring of all players in the ESPN pool, not only players who appeared on a Blackout Battlefield roster. The roster archive is used separately to determine whether a sleeper was acquired and started in this league.
Finding counts the number of different qualifying sleeper player-seasons a manager actually got into a starting lineup. Deploying counts the total weeks those qualifying players were started. Both measures are divided by completed seasons so managers with longer histories are comparable to managers with shorter ones.
In the bar chart, the total bar length is a manager’s sleeper impact starts per completed season. Gold is round 10+ and red is undrafted. The label at the end shows raw starts and unique player-seasons. In the scatter, the x-axis measures distinct sleepers found per season and the y-axis measures sleeper starts per season. Managers in the upper-right both identified more qualifying players and trusted them more often. Bubble size represents the points those sleeper starts produced above the relevant positional replacement line. Only managers with at least two seasons in the league are shown.